Ad fatigue in connected TV is simultaneously the most frequently discussed viewer experience problem in streaming and the least systematically addressed by most publishers and advertisers. Viewers complain about seeing the same ad dozens of times in a single evening. Brand research consistently shows that CTV campaigns with uncapped household frequency generate negative brand sentiment at high exposure levels, eroding the positive impact that earlier exposures created. And yet the default configuration of most CTV programmatic campaigns — device-level frequency caps rather than household caps, separate cap settings across DSP and publisher, and no coordination between multiple advertisers competing for the same households — produces exactly the ad fatigue conditions that damage both viewer experience and campaign performance. This guide explains what drives CTV ad fatigue structurally, how to diagnose whether your campaigns are creating it, and the specific technical and strategic interventions — at both the publisher and advertiser level — that reduce fatigue while preserving the reach and frequency that effective advertising requires. The tools are in the LtvAdx ad server and HouseholdID system; the decisions are editorial.
The structural causes of CTV ad fatigue
CTV ad fatigue has three structural causes that operate independently and compound when they occur simultaneously. Device identifier fragmentation is the first. A household with a Roku TV, a Fire TV stick, and an Apple TV — all streaming the same FAST channel or AVOD service — presents three separate device advertising IDs to the ad server. Each device carries its own frequency counter. A campaign capped at three impressions per device can serve nine impressions to the same household in the same evening. The viewer experiences nine exposures to the same ad; the campaign reports three impressions per device; the advertiser believes frequency controls are working.
The second cause is publisher-advertiser frequency coordination failure. Even when a single publisher enforces device-level frequency caps, multiple publishers running the same advertiser's campaign have no coordination mechanism without a shared household identity layer. A household that reaches the frequency cap on Publisher A and Publisher B simultaneously will have seen 2x the total intended exposure because each publisher managed only their own frequency window. This cross-publisher coordination problem is uniquely solvable through a unified exchange like LtvAdx where HouseholdID maintains frequency counts across all publishers within the exchange rather than in publisher-specific silos.
The third cause is creative monotony within correct frequency management. A household that has seen the same 30-second creative three times in two weeks may not have seen too many impressions — three exposures is within most brand research optimal frequency ranges — but if all three exposures are identical, the psychological fatigue effect is higher than if the exposures had varied messaging. Creative sequencing within the frequency cap addresses this: different creative variants at different frequency points in the retargeting or prospecting cycle reduce the monotony effect even at equivalent frequency levels.
How to diagnose ad fatigue in running campaigns
Ad fatigue is identifiable in campaign data before it becomes a brand damage problem, but only if you are measuring household-level frequency distribution rather than average frequency alone. Average frequency is a deceptive metric in CTV: a campaign reporting "3.2 average frequency" may have 40% of reached households at frequency 1–2 (underexposed) and 20% of households at frequency 8+ (severely overexposed), with the average concealing both problems simultaneously.
Request a household frequency distribution report from the LtvAdx reporting dashboard: how many unique households received 1 impression, 2 impressions, 3–5, 6–10, 10+? A healthy frequency distribution for a brand awareness campaign shows a majority of households in the 2–5 range with minimal households above 8 within a two-week window. A fatigue-risk distribution shows significant household concentration at the ceiling of the cap — when 15%+ of reached households are at the maximum configured frequency, the cap is not distributing impressions broadly enough across the audience pool.
Brand research provides the outcome confirmation that delivery data suggests. If post-campaign brand sentiment surveys show lower favorability among households with 7+ exposures than households with 3–5 exposures (which they consistently do in automotive, CPG, and financial services research), you have direct evidence of fatigue-driven sentiment erosion. Configure frequency distribution analysis as a standard post-campaign report alongside the VCR and reach metrics that campaign teams already review.
Publisher-side fatigue management
Publishers have both the responsibility and the commercial incentive to manage ad fatigue on their platforms. Viewer experience degradation from repetitive advertising drives app churn — the viewer who closes the FAST channel app and does not return represents permanent inventory loss. Publishers who protect viewer experience through active ad fatigue management retain audience longer than those who maximize short-term ad load.
The primary publisher-side fatigue control is competitive separation at the advertiser and category level within pods. Preventing the same advertiser from appearing more than once in a pod is standard competitive separation practice covered in the ad pod strategy guide. Extending this to category-level separation — preventing the same product category from dominating a break — produces a more varied ad experience even when the advertiser-level cap is enforced. A pod with one auto ad, one financial services ad, and one consumer goods ad provides a more varied experience than three auto ads from three different brands, even if advertiser-level separation is technically satisfied.
Session-level frequency controls — capping how many times a single household sees the same advertiser within a single viewing session, not just within a day or week — address the acute fatigue scenario that drives viewer complaints most frequently. A household watching three hours of FAST TV in an evening can encounter a weekly frequency cap and technically receive it within a single session. Configure session-level caps of 1–2 impressions per advertiser in the LtvAdx publisher portal for FAST channels with 3+ hour average session durations.
Advertiser-side fatigue management
Advertisers managing CTV campaigns must configure household-level frequency caps rather than device-level caps — this is the single most impactful technical change available for fatigue reduction. The CTV frequency capping guide covers household-level cap configuration in detail; the key point for fatigue management is that a "3 per household per week" cap means exactly that only when HouseholdID-based frequency counting is active. A "3 per device per week" cap on a household with three streaming devices means "up to 9 per household per week" in practice.
Creative rotation and sequencing is the second lever. Configure multiple creative variants within the same campaign and use creative-level frequency caps to ensure each household sees each variant before cycling. The first exposure might be a brand storytelling variant; the second a product benefit variant; the third a conversion offer variant. Three exposures with three distinct messages has lower fatigue impact than three exposures of identical creative because each exposure delivers incremental information rather than redundant repetition.
Flight length and recency management addresses the longer-term fatigue cycle. A continuous 90-day CTV campaign that accumulates 20+ household exposures over the quarter creates persistent fatigue that damages brand sentiment even when weekly caps are respected. Build flight-level gaps into long-duration campaigns — a two-week active period followed by a one-week hiatus, cycling through the quarter — to reset viewer fatigue levels between flight windows. This "pulsed" campaign structure maintains overall reach and total impression delivery while reducing the cumulative exposure that generates fatigue at the household level.
Ad load management at the platform level
Platform-level ad load — the total minutes of advertising per hour of content — is the upstream driver of ad fatigue. Publishers who run 18+ minutes of ads per hour on FAST channels create structural overexposure that no per-advertiser frequency cap can fully remedy. When the ad load is high enough, every household in the audience receives multiple exposures to multiple advertisers per hour regardless of campaign-level caps.
The viewer research on ad load tolerance in streaming consistently identifies 10–14 minutes of advertising per hour as the range where completion rates and session length are maximized. Above 16 minutes per hour, incremental ad load begins to reduce total session length in a way that lowers total ad minutes delivered despite the higher load rate — the viewer quits earlier. This is the paradox that the yield optimization guide addresses: reducing ad load within the optimal range often increases total ad revenue per hour of content by increasing session length and completion rates more than the load reduction costs in slot count.
Fatigue signals in programmatic demand
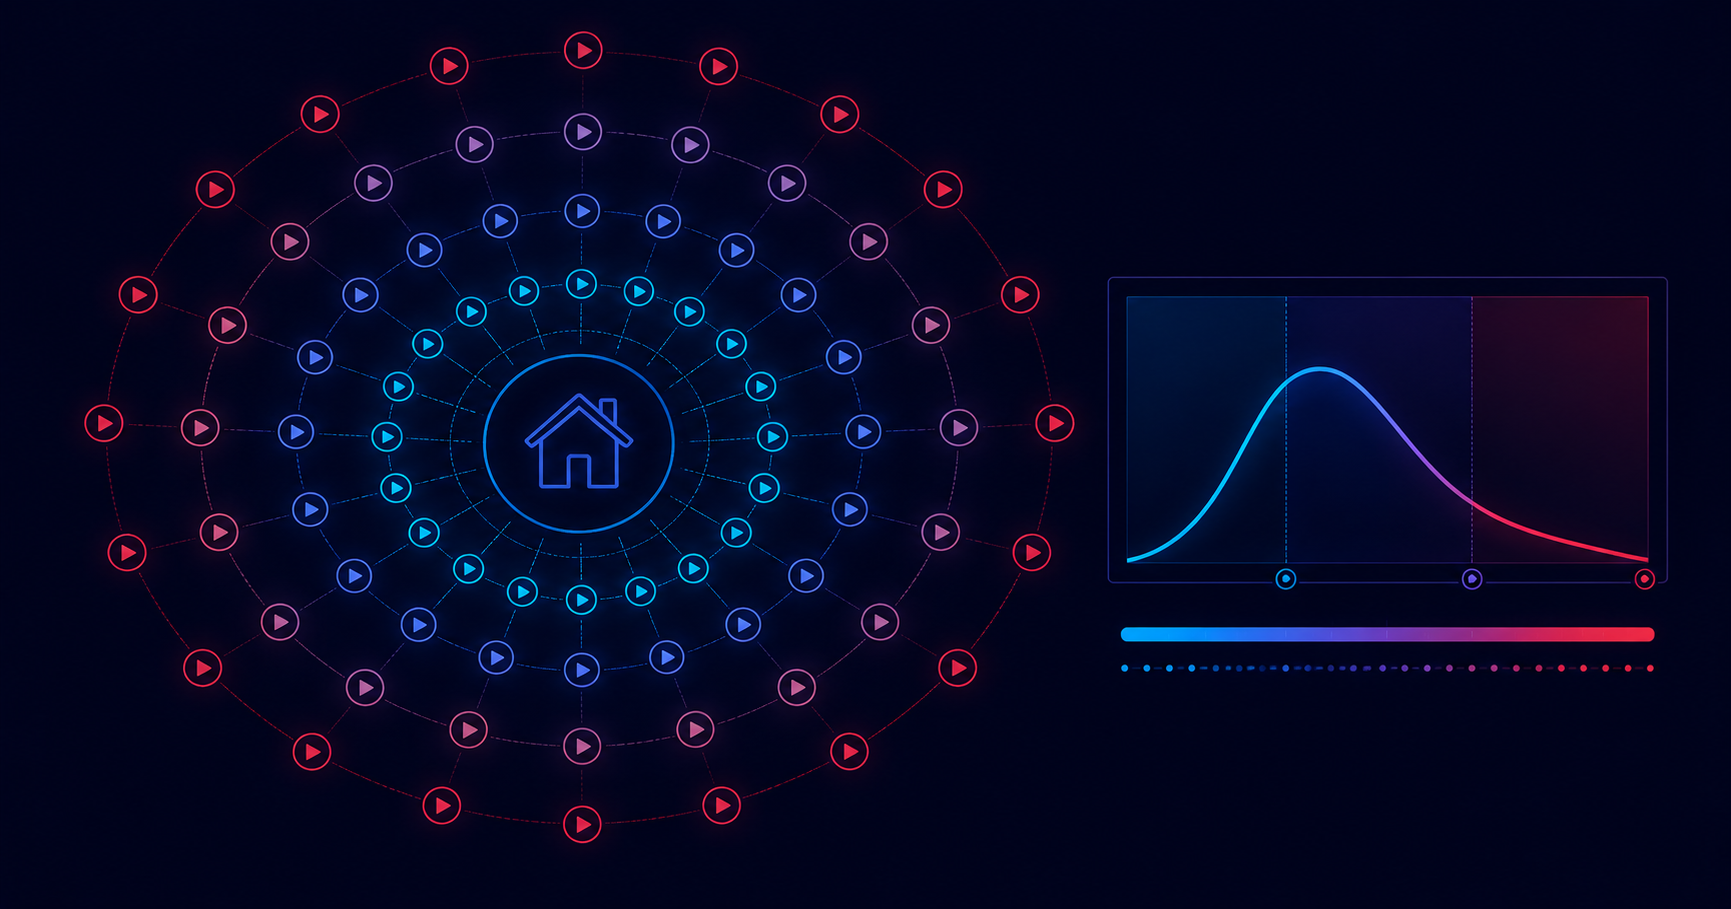
DSPs running CTV campaigns have visibility into a signal that publishers lack: post-exposure brand sentiment and conversion data that reveals when frequency has crossed into negative territory. DSPs with access to brand lift data or site visit attribution can observe the frequency-response curve: how does conversion or sentiment lift change as household frequency increases? The typical finding — positive lift at 2–5 exposures, diminishing returns at 5–8, and potential negative impact above 8–10 — defines the optimal frequency window for different campaign objectives and categories.
Sharing this frequency-response data with publishers through deal agreements enables a publisher-advertiser optimization that purely competitive programmatic auctions do not produce. A publisher who knows that a specific advertiser's optimal frequency is 4 per household per week can configure deal-level session controls that enforce this ceiling — producing better advertiser outcomes while also improving viewer experience on the publisher's platform. This kind of collaborative frequency management is one of the concrete advantages of programmatic guaranteed and direct IO deal structures over open auction buying, where no such coordination mechanism exists. For publishers and advertisers interested in configuring collaborative frequency management within LtvAdx, contact the solutions team or request a platform walkthrough.