CTV advertising generates more measurable data per impression than almost any other ad format. VAST event beacons record playback progression at four quartile milestones. Device signals identify the platform, household IP, and advertising identifier for every impression. Auction logs capture the bid landscape, clearing price, deal ID, and creative selector for every decision. The problem is not a shortage of data — it is the gap between what the platform produces and what most publishers and advertisers actually analyze. The majority of CTV reporting practice stops at delivery counts and average CPM, leaving the richer signals untouched. This guide covers the full reporting stack available to publishers and advertisers on the LtvAdx reporting platform, what each data layer tells you, and how to build the analytical workflows that translate raw impression data into yield optimization, audience insight, and campaign performance improvement.
The four layers of CTV reporting data
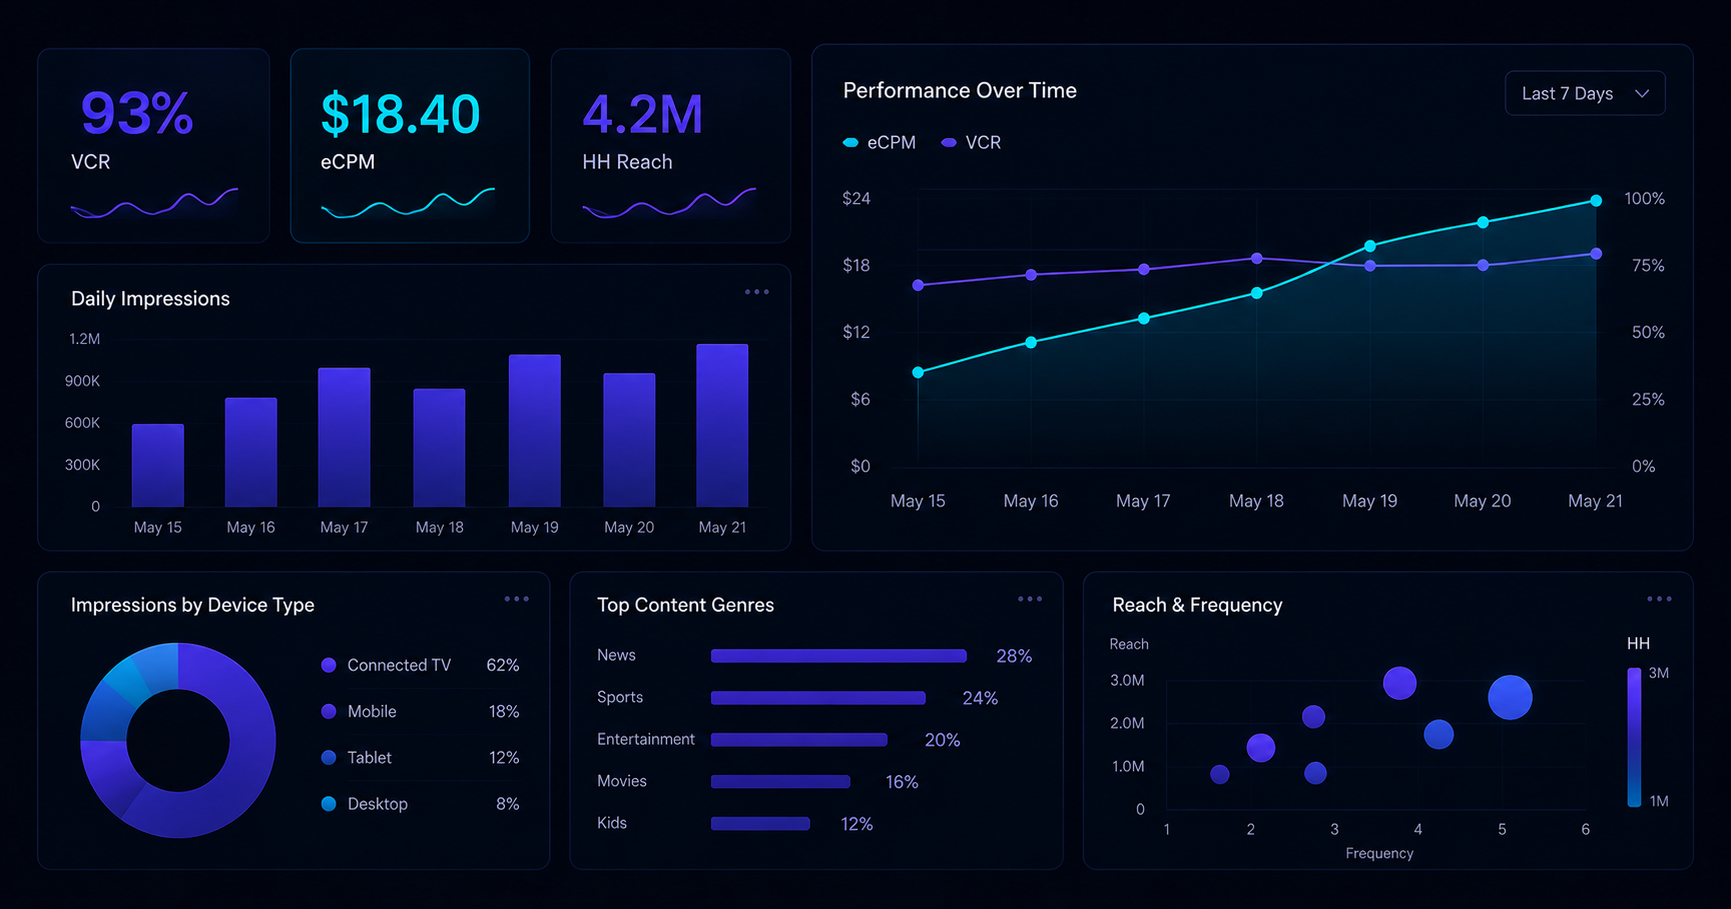
CTV reporting data exists at four distinct layers of granularity, each providing different analytical value. Delivery reports — the most commonly used layer — aggregate impressions, CPM, fill rate, and completion rate by time period, content genre, or deal. Delivery reports answer "what happened" at a summary level. Auction event logs go deeper: every bid request, the bids received, the winning bid, the clearing price, and the bid request parameters that influenced the auction. Auction logs answer "why did it happen" — they reveal whether low fill is caused by low floor prices, insufficient demand density, or inventory metadata that buyers are filtering against.
The third layer is household analytics: delivery segmented by HouseholdID cohorts, showing reach (unique households), frequency distribution, and demographic composition of the delivered audience. Household analytics answer "who did it happen to" — the audience dimension that delivery reports collapse into anonymous impression counts. The fourth layer is outcome attribution: the post-exposure analysis connecting delivered impressions to downstream household behavior. Outcome data answers "what did it cause" — the highest-value analytical output for performance-oriented publishers and advertisers.
Most publishers use only the first layer. Publishers who also use auction event logs can improve fill rates and CPMs in ways that delivery reports alone cannot reveal. Publishers who incorporate household analytics can build audience-based deal packages that command premium CPMs. Publishers who implement outcome attribution can demonstrate ROI to direct advertisers in a way that transforms sales conversations. Each layer requires incrementally more analytical infrastructure but delivers incrementally higher commercial value.
Delivery reporting: what to measure and at what granularity
A complete delivery report for a CTV publisher should segment at minimum by: content genre, daypart, device type (CTV vs mobile if you serve both), deal type (direct, programmatic guaranteed, PMP, open auction), pod position (slot one vs slot two vs slot three), and demand source (which SSP or DSP won the impression). Each of these dimensions reveals optimization opportunities that aggregate reporting conceals.
Genre segmentation reveals whether your floor prices are calibrated correctly by content type — a flat floor across crime drama and children's programming will underprice the drama and produce low fill on the kids content (because eligible advertisers are narrower). Daypart segmentation reveals whether your prime-time inventory is clearing at a significant premium to overnight inventory — if the premium is small, your prime-time floors may be too low. Pod position segmentation is discussed in depth in the ad pod strategy guide — first position should command a material CPM premium over second and third position. If it does not, you may not be passing position metadata to buyers or may not have position-differentiated floor pricing.
The fill rate metric deserves particular attention. Overall fill rate is a composite metric that masks the underlying distribution: some publisher inventory may clear at 95% fill while other inventory clears at 40%. Reporting overall fill rate as a single number averages across this distribution and makes it impossible to identify which specific inventory segment is underperforming. Segment fill rate by genre, daypart, deal tier, and device type to identify the specific segments requiring floor price, category targeting, or demand configuration changes.
Video completion rate and what it actually measures
Video completion rate (VCR) — the percentage of delivered impressions where a VAST complete beacon fires — is the most commonly cited CTV KPI and one of the most frequently misinterpreted. The VCR vs completion rate analysis covers the technical distinctions in detail; the reporting implications are worth summarizing here.
VCR measures beacon firing, not viewer attention. In an SSAI environment where beacons are fired by the stitcher based on manifest timing rather than player events, a VAST complete event fires at the time offset corresponding to ad end in the manifest — regardless of whether the player was actively rendering that content, whether the screen was on, or whether the viewer was present. A publisher reporting 96% VCR from a stitcher-fired beacon implementation is not confirming that 96% of impressions were actively watched — it is confirming that 96% of impressions reached the complete beacon timing offset in the manifest.
This does not mean VCR is useless — it is a valid measure of delivery completion and a useful signal for identifying playback errors (impressions that start but do not reach complete, indicating potential buffering or player error). But it should not be used as a proxy for viewer attention or brand recall. For advertisers who require viewer presence validation, player-fired beacons via client SDK integration provide a more accurate signal. Understand which beacon mode your publisher is using before drawing conclusions from VCR data.
Auction analytics: diagnosing yield problems
Auction event logs are the diagnostic tool for yield optimization that delivery reports cannot provide. The key metrics to extract from auction logs are: bid density (how many bids are received per impression), timeout rate (what percentage of ad calls receive no response within the configured window), clearing price distribution (the spread of winning CPMs, not just the average), and no-fill reason segmentation (why did an ad call return no creative — floor price too high, no eligible demand, category conflict, or timeout?).
Low bid density (fewer than 3–4 bids per impression) indicates that insufficient demand is seeing the inventory. This can result from inventory metadata that buyers are filtering against (inaccurate or missing content category declarations in bid requests), floors that are above the competitive range for the demand currently configured, or simply insufficient demand source configuration (too few SSPs or DSPs connected). The publisher portal demand configuration section shows which demand sources are active and their bid response rates.
High timeout rates — impressions that receive no response from any demand source within the configured window — indicate latency problems in the demand path. If specific demand sources have high timeout rates, their endpoint may be experiencing performance issues or their ad server may be deprioritizing your inventory category. The LtvAdx reporting API surfaces timeout rates by demand source, enabling publishers to identify and deprioritize consistently slow demand partners before they damage overall fill rate.
Household analytics: building audience insight from CTV data
Household analytics transforms impression data into audience intelligence. By resolving delivered impressions to HouseholdID cohorts and cross-referencing against available demographic and behavioral enrichment data, publishers can understand who their audience is — not just how many impressions were served. This audience intelligence has two commercial applications: improving deal packaging (presenting buyers with verified audience composition data rather than self-asserted demographics) and informing content and schedule decisions (understanding which programming attracts which audience segments).
The household analytics metrics that carry the most commercial value in publisher conversations with buyers are: unique household reach (total distinct households reached per time period), household composition by income tier, household composition by purchase category interest, and household co-viewing index (how often does this channel attract multi-person viewing sessions). These metrics position your inventory as an audience asset rather than a slot-count commodity, which is the pricing conversation that commands premium CPMs.
For advertisers, household analytics provides post-campaign audience delivery verification: did my campaign actually reach my target audience segment, or did it deliver broadly to whichever households happened to be watching the content? A campaign that targeted adults 25–54 in households with income above $75,000 and delivered primarily to households outside that profile is not the campaign the advertiser bought. Audience verification reports, built from the same HouseholdID data that powers targeting, provide the accountability that moves CTV from "reach channel" to "verified audience channel" in media plans.
Building a CTV reporting infrastructure
The LtvAdx reporting stack exports data at each of the four layers described above through the reporting API. Delivery aggregates are available in the dashboard UI with flexible dimension grouping and date range selection. Impression-level event logs are available via API export in JSON or CSV for warehousing. Auction event logs are available via streaming export for real-time analytics use cases. Household reach and frequency reports are available as scheduled exports through the API.
The recommended analytics infrastructure for a publisher or advertiser operating at scale is: impression-level logs flowing into a data warehouse (BigQuery, Snowflake, or Redshift are common), a BI layer (Looker, Tableau, or Mode) connected to the warehouse for delivery and yield reporting, and a separate household analytics pipeline that joins impression logs to the HouseholdID enrichment data for audience reports. This infrastructure gives teams the ability to answer yield, audience, and attribution questions without depending on the platform UI for every analytical query.
For publishers and advertisers who prefer managed reporting, the LtvAdx dashboard covers most operational needs without requiring warehouse integration. Scheduled email reports, configurable KPI alerts, and exportable summary reports are available in the dashboard for teams who need regular visibility without analyst involvement. The reporting integration documentation covers both the managed dashboard and the API export setup. For agencies managing multiple client accounts, the multi-seat reporting interface provides cross-client views with account-level isolation for confidential client data.
For publishers building their first CTV analytics practice or advertisers moving from basic delivery reports to the richer analytical frameworks described here, the most practical starting point is the auction analytics layer — the yield optimization insights it provides have direct revenue impact with relatively low implementation complexity. The household analytics and attribution layers are the next priority for publishers with direct sales operations and advertisers with performance measurement requirements. To discuss your specific reporting and analytics requirements, contact the LtvAdx analytics team or request a demonstration.