CTV advertising CPMs are the most frequently misunderstood number in media planning conversations. Buyers look at a $25–$40 CTV CPM and compare it against a $5–$12 digital pre-roll CPM and conclude CTV is expensive. The comparison is structurally wrong because it ignores completion rate, viewability, household reach, and the absence of skip functionality that make the two formats produce completely different advertising outcomes per impression served. This guide breaks down CTV advertising costs with precision: what drives CPM variation, how to calculate true cost-per-outcome metrics that make cross-channel comparison valid, and how to structure your CTV buy on the LtvAdx platform to achieve the CPM profile your campaign objective actually requires.
CTV CPM ranges by inventory tier and deal type
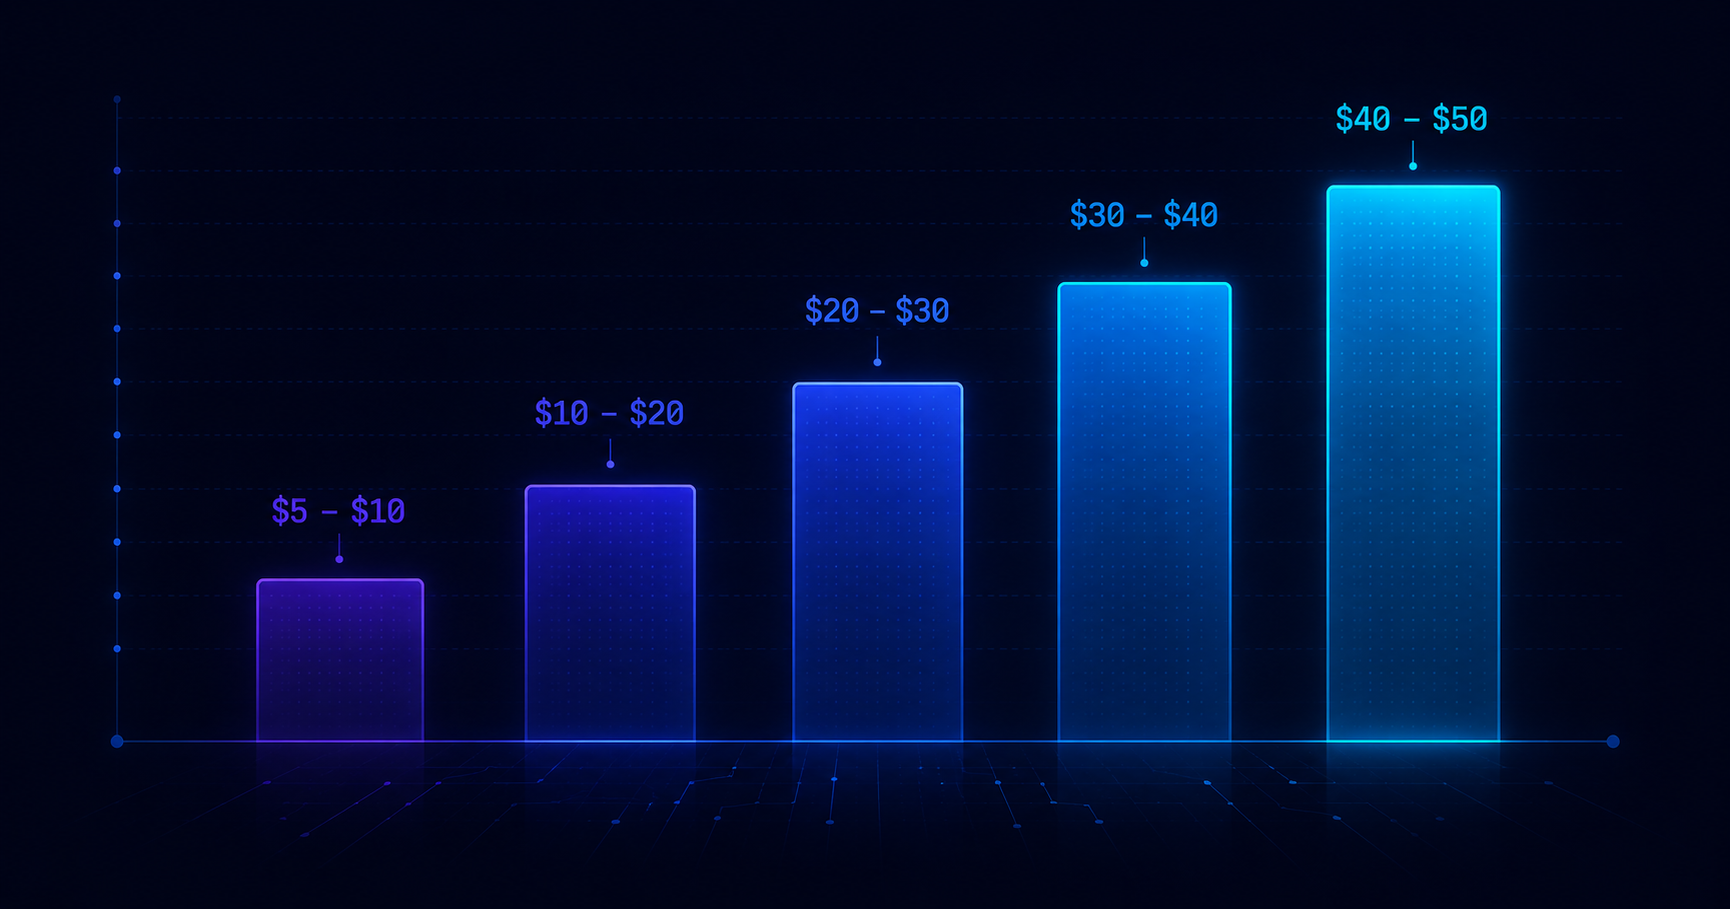
CTV CPMs span a wide range depending on inventory tier, deal structure, audience targeting richness, and content genre. Open auction programmatic on general entertainment FAST channels without identity enrichment clears at $10–$18 CPM. The same FAST channel inventory with HouseholdID-enriched audience segments — income, purchase intent, or first-party CRM match — clears at $18–$28 CPM. Premium content inventory on major streaming platforms, particularly live sports and prime-time originals, clears at $30–$55 CPM in programmatic guaranteed deals and higher in direct IO arrangements. Live sports tentpole inventory — Super Bowl adjacency, playoff games, championship events — routinely exceeds $50 CPM in direct deals with significant share-of-voice premiums.
Deal type produces the second major CPM variation. Open auction clearing prices reflect real-time supply and demand balance — they are lowest during low-demand dayparts and lowest-competition inventory but offer no delivery guarantee. Private marketplace deals carry floor CPMs set by the publisher (typically $15–$30 for quality CTV supply) and give the buyer priority access to defined inventory without volume commitment. Programmatic guaranteed deals price at negotiated CPMs (often at a premium above PMP floors) in exchange for committed volume — the publisher reserves inventory and the buyer commits to taking it. Direct IO deals with sponsorship and share-of-voice provisions are priced furthest above programmatic and carry the highest CPMs in the market.
The LtvAdx pricing model operates on a transparent CPM fee structure without hidden intermediary margins. Publishers see gross CPM; the platform fee is disclosed; net publisher revenue is calculable from reported gross figures. For buyers, the total cost of an LtvAdx-executed impression is the clearing CPM plus the data fee if third-party audience segments are activated — there are no undisclosed technology fees layered between the buyer's bid and the publisher's net revenue.
The correct comparison metric: cost per completed view
A $30 CTV CPM and a $10 digital pre-roll CPM are not comparable at face value because completion rates are not equivalent. CTV ads are non-skippable in the vast majority of streaming environments; completion rates consistently measure 90–95%. Skippable digital pre-roll sees completion rates of 25–45% on platforms with skip options after five seconds. Non-skippable digital video (YouTube 6-second bumpers, forced-play in-stream) reaches 95%+ completion but delivers a fraction of the brand message that a 30-second CTV ad communicates.
Cost per completed view (CPCV) normalizes these differences. At $30 CPM and 93% completion, CTV delivers a CPCV of $0.032 — meaning each complete ad view costs three cents. At $10 CPM and 35% completion, skippable pre-roll delivers a CPCV of $0.029. The CPM gap of $20 produces a CPCV difference of less than half a cent, while CTV delivers a 30-second full-screen television experience versus a 5-second forced view before skip. For brand campaigns where message delivery is the objective, CPCV is the only CPM comparison that produces a valid cross-channel analysis.
For performance campaigns where conversion is the objective, the relevant metric is cost per household outcome: site visits, searches, purchases. The CTV attribution guide covers how to measure post-exposure outcomes at the household level. Cost per household site visit from CTV typically runs $0.80–$2.50 depending on category, audience targeting quality, and creative effectiveness — comparable to or below equivalent search retargeting costs for considered-purchase categories.
What drives CPM variation: the seven factors
Understanding CPM variation requires understanding the seven factors that publishers and market dynamics use to price CTV inventory. Content genre is the first and most impactful: live sports commands 2–3x the CPM of equivalent entertainment programming because advertiser demand for sports adjacency consistently exceeds supply, particularly for marquee events. News content commands a premium for certain advertiser categories (financial services, pharma) and a discount for others (consumer goods brands with news adjacency restrictions).
Daypart is the second factor: prime-time (6pm–11pm) inventory clears at 30–50% higher CPMs than daytime inventory on the same channel because audience size and advertiser demand both peak in the evening. Overnight inventory may clear at 50–60% below prime-time levels. Identity enrichment is the third factor: anonymous inventory clears at base rates; inventory enriched with HouseholdID demographic and behavioral signals clears at a 30–60% premium because buyers pay more for verified audience targeting.
Deal type and commitment level is the fourth factor (covered above). Platform tier is the fifth: premium SVOD/AVOD platforms with high-quality original programming command premium CPMs because their content environment and audience composition are better documented. FAST channels carry lower CPMs on average but vary significantly by channel quality and audience demographics. Geographic concentration is the sixth factor: inventory in major metros (New York, Los Angeles, Chicago) and high-income suburbs commands 20–40% premiums over rural or low-income geographic segments due to advertiser demand concentration. Competitive pressure is the seventh: inventory categories with dense advertiser competition — auto, pharma, financial services in Q4 — see clearing CPMs 20–35% above the same inventory in lower-competition periods.
CTV CPM seasonality and budget planning
CTV advertising costs follow a seasonal pattern that mirrors linear television's historical price cycles, amplified by streaming-native demand spikes. Q4 is the most expensive quarter by a significant margin: holiday advertising demand from retail brands competes with political advertising in even-numbered years and standard upfront scatter demand, producing clearing CPMs 30–50% above Q1 and Q2 averages on comparable inventory. January experiences a demand trough — budgets reset, political spending ends, holiday campaigns conclude — producing the year's lowest clearing CPMs, often 25–35% below Q4 peaks.
For brands with flexible campaign timing, Q1 and Q2 offer the best CPM efficiency for awareness and brand-building campaigns. Q3 is a mid-season period with rising demand as the upfront scatter market heats up and back-to-school advertising begins. Q4 should be budgeted at a premium — attempting to execute Q4 CTV campaigns at Q1 CPM expectations will produce systematic underdelivery because clearing prices have moved above budget floors. Plan Q4 CTV budgets at 130–150% of your annual average CPM benchmark, not your most recent campaign CPM.
For live sports specifically, event-driven price spikes are predictable but not constant. Major sporting events — championship games, season openers, rivalry matchups — command significant premiums above regular season inventory on the same channel. Build event-level CPM premiums into sports campaign budgets rather than using regular-season clearing prices as the budget basis for playoff or championship campaigns.
Publisher floor prices and yield management
From the publisher side, floor prices are the primary yield management lever. A floor price is the minimum CPM at which a publisher will sell an impression — bids below the floor are rejected and the slot goes to the next tier of demand or slate. Floor prices should be set to reflect the true value of inventory rather than as arbitrary barriers: a floor set too high produces unfill; a floor set too low leaves revenue on the table when demand is competitive.
Publishers on LtvAdx configure floor prices in the publisher portal with the ability to set different floors by daypart, content genre, and deal tier. The yield optimization framework in the FAST channel yield guide covers floor price calibration methodology in detail. For publishers evaluating what CPM their inventory should command, the LtvAdx reporting dashboard surfaces clearing price distribution and bid density data that reveal whether current floors are above or below market-clearing levels.
ROI calculation for CTV campaigns
CTV ROI calculation requires connecting impression cost to business outcome value — a chain of measurements that most campaigns do not configure before launch. The framework has four steps. Step one: calculate cost per household reach (total spend divided by unique households reached, not impressions served). Step two: measure household outcome rate (percentage of reached households that take the target action — site visit, search, purchase — within the attribution window). Step three: calculate cost per outcome (cost per household reach divided by outcome rate). Step four: compare cost per outcome to the average customer or lead value to determine ROAS.
A worked example: $50,000 campaign spend at $25 CPM delivers 2,000,000 impressions and reaches 750,000 unique households (assuming 2.7 impressions per household average frequency). Cost per unique household reached: $0.067. If 2.5% of reached households visit the site within 14 days (18,750 site visits), cost per site visit is $2.67. If 8% of site visitors convert (1,500 conversions), cost per acquisition is $33.33. If average customer lifetime value is $150, ROAS is 4.5x on first-transaction value alone.
This framework is not possible without the measurement infrastructure to count unique household reach and attribute post-exposure outcomes. Configure measurement before launch using the LtvAdx reporting API for household reach data and the attribution methodology covered in the attribution guide. For publishers and buyers new to LtvAdx pricing, review the pricing page for the platform fee structure or request a demonstration to discuss CPM expectations for your specific inventory category or campaign objective.