CTV Reach Curves: Why 70% Becomes 35%
The standard planning formula assumes perfect frequency control. Without it, a plan for 70% reach at frequency three delivers effective reach nearer 35%.

The standard CTV planning equation is impressions equals reach multiplied by frequency. Plan 70% reach of a million households at an average frequency of three, and it tells you to buy 2.1 million impressions.
Buy them without frequency control and you will reach about 88% of households, which is better than planned, while the share that actually sees the ad three or more times is roughly 35%.
Half the effective reach you planned for, at exactly the budget you planned for it. The equation did not fail arithmetically. It failed because it assumes something about delivery that is never true.
What the linear formula assumes
Impressions equals reach times frequency is correct if, and only if, every household you reach receives exactly the average number of exposures.
That would require perfect delivery control: the ability to direct precisely three impressions to precisely 700,000 chosen households and stop. No household gets a fourth. None gets two.
Real delivery does not work that way. Impressions land where inventory becomes available, against households that happen to be watching, through publishers who each see only their own slice of your buy. The result is a distribution rather than a constant, and the distribution is where the planning goes wrong.
Some households see the ad eight times. Many see it once. A meaningful number never see it at all, including households you were specifically targeting and paying to reach.
The average is still three. The average was never the thing you cared about.
The distribution, made concrete
Take the cleanest possible model: one million target households, three million impressions delivered with no frequency control, exposures falling essentially at random.
Exposures per household    Share of universe
  0 times                        5.0%
  1 time                        14.9%
  2 times                       22.4%
  3 times                       22.4%
  4 times                       16.8%
  5 times                       10.1%
  6 or more                      8.4%

  Reach (1+)                    95.0%
  Effective reach (3+)          57.7%
Average frequency is exactly 3.0. Reach looks excellent at 95%.
But if your effective frequency threshold is three, the level at which reporting from Nielsen, Comscore and the IAB broadly agrees performance separates from noise, then only 57.7% of the universe was effectively reached. The other 42% received one or two exposures, which the same research suggests underperforms substantially.
Meanwhile 8.4% of households saw the ad six or more times. Those impressions were paid for, delivered, counted as working media, and contributed nothing beyond the third exposure. That waste is the subject of where your CTV ad dollar actually goes, and it is entirely invisible in an average.
An honest caveat about the model
Purely random exposure is a simplification. Real CTV delivery is neither uniform nor perfectly random. It sits between the two, and where it sits depends almost entirely on how much frequency control is actually in force across the buy.
Uncapped delivery across many publishers with no shared identity is close to the random case. Well-capped delivery with household-level identity across the whole buy moves toward the uniform case, which is the one the linear formula assumes.
So the random model is not a prediction. It is the honest floor: what you get when nothing is controlling frequency. The linear formula is the ceiling: what you get when everything is. Most real campaigns sit between, and knowing which end you are nearer is worth more than any single number in a plan.
The reach curve, and where it stops being worth buying
The second thing the linear formula hides is that reach does not scale with spend. Each additional impression is more likely than the last to land on a household you have already reached.
Against a million-household universe at a $25 CPM:
Impressions   Reach    Households   Spend      Cost per 1,000
                                                  reached
  500,000     39.3%      393,000    $12,500       $31.77
1,000,000     63.2%      632,000    $25,000       $39.55
1,500,000     77.7%      777,000    $37,500       $48.27
2,000,000     86.5%      865,000    $50,000       $57.83
3,000,000     95.0%      950,000    $75,000       $78.93
4,000,000     98.2%      982,000   $100,000      $101.87
5,000,000     99.3%      993,000   $125,000      $125.85
The first 500,000 impressions buy 393,000 households. The fifth 500,000 buys about 44,000. Same price, roughly a ninth of the result, and nothing in a standard delivery report distinguishes them.
Cost per thousand households reached rises from $31.77 to $125.85 across that range, roughly four times, while the media CPM never moves. You paid $25 per thousand impressions throughout. The impressions got no more expensive. They just got less useful.
This is why a reach target above about 90% deserves a specific justification rather than an aspiration, and why the deal types that guarantee delivery rather than reach are priced the way they are, as covered in programmatic guaranteed. The last several points cost more per household than the first sixty, and in most campaigns that money buys more by going into frequency control on the households already reached.
Getting the universe right first
Everything above depends on the denominator, and the denominator is where plans most often go wrong before any arithmetic starts.
A universe estimate is a count of the households you consider addressable for this campaign. Get it wrong and every downstream number is wrong in the same direction, invisibly.
Overstate it, by using a demographic population rather than a reachable one, and your reported reach percentage looks poor while your absolute delivery is fine. Teams respond by buying more impressions against a denominator that was never achievable.
Understate it and reach percentages look excellent, frequency looks controlled, and the campaign quietly under-delivers against the actual market.
Three adjustments turn a population figure into something usable.
Streaming penetration. Not every household in a geography has a connected television, and the ones that do skew by age and income in ways that matter for the audience definition.
Ad-supported share. Households on ad-free subscription tiers are not addressable at any price. The split varies substantially by service and shifts as pricing changes, which is one reason a universe estimate has a shelf life rather than being a fixed property of a market. The inventory landscape it depends on is mapped in FAST channel monetization.
Your actual supply footprint. The households reachable through the publishers you are actually buying, which is always smaller than the households that exist. This is the adjustment most often skipped, and the one that most often explains a plan that looked fine and delivered poorly. Building the footprint deliberately is covered in CTV campaign planning, and the targeting layer in CTV audience segments.
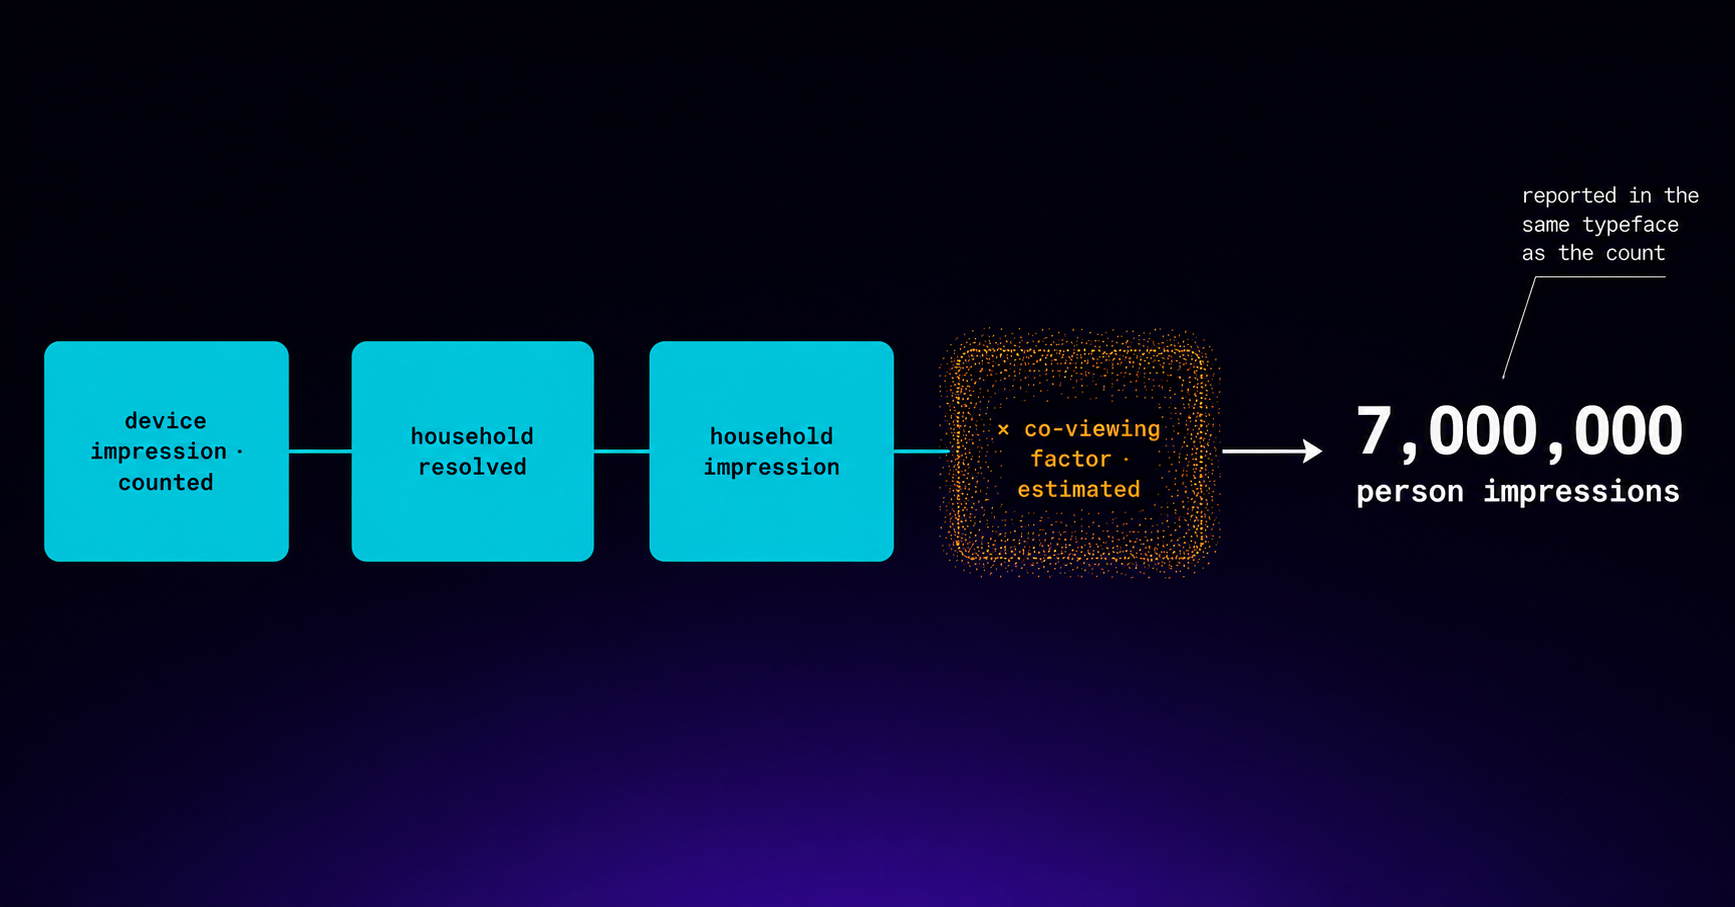
There is a further wrinkle specific to CTV: your universe is measured in households, and buyers frequently want people. Converting between them requires a co-viewing multiplier, which is a number with its own problems — every party in the transaction benefits when it is larger, and nobody audits it. We covered that in the co-viewing piece.
What frequency capping actually buys you
Capping is normally justified on viewer experience grounds: do not annoy people. That argument is correct and it dramatically undersells the case.
Look again at the distribution. With no control, 8.4% of the universe received six or more exposures against an average of three. Those surplus impressions were bought, delivered and wasted.
A cap does not delete them. It redistributes them. An impression that would have been a household's seventh exposure instead goes to a household with one, or none.
Which means a cap raises effective reach at constant spend. Same budget, same CPM, same impression count, more households above the threshold that matters. It is not a cost-control measure. It is a yield improvement, and it is one of the few in media that requires nothing from the seller.
The mechanics, and why household-level identity is the hard part, are in CTV frequency capping and household ID and identity.
The cross-publisher problem
Here is why this stays broken in practice despite everyone agreeing it matters.
A cap applied inside one publisher limits exposures on that publisher. It says nothing about the same household on four other publishers in your buy, because those publishers cannot see each other.
Buy across six services with a cap of three on each, and the theoretical maximum exposure for one household is eighteen. In practice the tail is shorter than that but considerably longer than three, and the campaign reports an average that looks entirely healthy.
Cross-publisher capping requires a shared household identifier, which requires identity infrastructure, which is why it remains one of the largest sources of avoidable waste in CTV. Our own approach runs the check against a Redis-backed counter at decision time — one of the few things in our serving path that deliberately reads live state rather than the in-memory snapshot, because a cap that is fifteen seconds stale will overdeliver.
Planning against the curve instead of the formula
A practical sequence that produces numbers you can defend.
- Build the universe from supply, not from population. Start with the households reachable through publishers you will actually buy, then apply audience definition. Not the other way round.
- State an effective frequency threshold, not an average. Reporting broadly supports three to five exposures for most objectives, with brand campaigns tending higher and direct response campaigns tending lower. Whatever you choose, the number that matters is the share of the universe reaching it — not the mean.
- Plan to effective reach. Ask for the share of the universe expected at three-plus exposures, not the headline reach figure. If a partner cannot produce that number, they are modelling with the linear formula.
- Find where the curve bends before setting the budget. Cost per household reached is the metric that reveals it, and it moves long before anything else in the plan looks wrong.
- Cap across the whole buy, not per publisher. Per-publisher caps multiply. Only a shared household identifier prevents that.
- Measure the delivered distribution, not the delivered average. An average frequency of 3.0 is consistent with almost any distribution, including several that failed.
The last one is the single most useful change most teams could make. A frequency distribution is a histogram, it is trivially producible from log-level data, and almost nobody asks for it. What that data makes visible is discussed in CTV reporting and analytics.
Publisher overlap, the other invisible cost
Everything so far assumed one pool of households. A real CTV buy runs across several publishers, and they share audience.
Add a fourth service to a buy that already has three, and the incremental reach it delivers is not its own reach figure. It is only the households it reaches that the first three did not. That number is always smaller than the headline, sometimes dramatically so, and no publisher can tell you what it is because none of them can see the others.
The consequence is a specific planning error. A media plan built by summing each publisher's reach will overstate total reach every time, and the overstatement grows with the number of publishers rather than shrinking. Six services each claiming 20% reach of your target do not deliver 120%, and they do not deliver 100% either.
Two practical responses.
Ask for incremental reach rather than reach. Any partner who can deduplicate across your buy can produce it. One who cannot is telling you that your total reach figure is a sum of overlapping numbers.
Sequence the buy rather than sizing it all at once. Add publishers in order of expected incremental contribution and stop when the increment stops justifying the CPM. This is the same diminishing-return logic as the reach curve, applied across supply instead of within it, and it interacts directly with the path consolidation argument in supply path optimization.
Overlap also produces the frequency problem described above, since a household present on four of your six services is a household with four independent chances to be over-exposed. Reach overlap and frequency waste are the same phenomenon measured from two directions.
A plan, worked end to end
Putting the pieces together on a single campaign, because the individual mechanics are easier to accept than the combined effect.
A brand wants to reach adults 25 to 54 in a metro area, with a $75,000 CTV budget, over four weeks.
Step one, the universe. The metro has roughly 1.8 million households. Applying streaming penetration, then ad-supported share, then the households actually reachable through the six services in the plan, the addressable universe lands near 1 million. Note that the population figure and the usable figure differ by almost half, and that the difference is entirely in adjustments a population-based plan never makes.
Step two, the impressions. At a $25 CPM, $75,000 buys 3 million impressions. That is fixed by the budget and the market rate, not by the plan.
Step three, what the linear formula predicts. Three million impressions against a million households at an average frequency of three implies reaching every household in the universe three times. A plan document would record 100% reach at frequency 3.
Step four, what uncontrolled delivery produces. Reach of 95%, effective reach at three-plus of 57.7%, with 8.4% of households receiving six or more exposures.
Step five, the decision that follows. The plan as written spends the full budget chasing a reach number that was already achievable at two thirds of the spend. Reallocating toward frequency control across publishers, rather than toward more impressions, moves households from the one-and-two-exposure bands into the effective band without buying anything additional.
The campaign that results looks worse on the headline reach line and better on every line that predicts outcome. Which is a difficult conversation to have with a client who was promised a reach number, and the reason the linear formula persists despite everyone in the room knowing its assumptions do not hold.
What to ask before signing the plan
Five questions. Each is answerable by any partner doing this properly, and the answers are diagnostic even when they are unsatisfying.
What universe estimate is this reach percentage calculated against, and how was it derived? If the answer is a population figure rather than a supply-adjusted one, every percentage in the plan is optimistic by an unknown margin.
What is the projected effective reach at three-plus exposures? The single most useful question in the list. A partner modelling with the linear formula cannot answer it, because the formula does not produce a distribution.
Is the frequency cap applied across the buy or within each publisher? Per-publisher caps multiply, and the difference between the two is usually the difference between a controlled campaign and an uncontrolled one.
What is the incremental reach of each publisher, in the order they are added? This exposes overlap, and it frequently reveals that the last two services in a plan are contributing far less than their individual reach figures imply.
Will I receive the delivered frequency distribution, not the average? Ask before the campaign rather than after. A partner who commits to it in advance will have the log-level data to produce it, which is a useful signal about the rest of the reporting. The general case for asking is in CTV attribution and measurement.
None of these are adversarial questions. They are the ones a planner would ask themselves if the tooling made the answers easy to get, which for most of the market it currently does not.
The model underneath
For anyone who wants to know what is actually computing this rather than taking the numbers on trust.
Media planners have used the Sainsbury-Agostini negative binomial reach model for decades, and it holds up in CTV for the same reason it held up in linear television: it models exposure as a distribution with a shape parameter rather than as a constant, which is what real audiences produce.
The random model used in this piece is the simpler cousin of that, and it is deliberately the pessimistic end. It assumes no frequency control whatsoever. Every capping mechanism you apply moves the real result away from it and toward the linear formula's optimism.
The point of showing the pessimistic end is not that it predicts your campaign. It is that the gap between it and the linear formula is the size of the prize available from frequency control — and that gap is far larger than most media plans imply.
At the numbers above: 35% effective reach uncontrolled against 70% planned. That difference is not a rounding error in a model. It is the campaign.
If you want to see reach and frequency modelled against a real supply footprint rather than a population estimate, the reporting tools cover delivered distributions and the identity layer covers the household resolution that makes cross-publisher capping possible. To walk through a specific plan, get in touch.
Frequently asked questions
How many impressions do I need for a CTV reach goal?
More than the standard formula suggests if you care about effective reach rather than reach. Impressions equals reach times frequency assumes every reached household receives exactly the average number of exposures, which requires perfect frequency control. Without it, delivery forms a distribution: at three million impressions against a million households, 95% see the ad at least once but only about 58% see it three or more times. Plan against the distribution, not the average.
What is the difference between reach and effective reach?
Reach counts households exposed at least once. Effective reach counts households exposed at or above the threshold where the advertising actually works, commonly taken as three or more exposures. The gap between them is large and routinely invisible in planning. A campaign reporting 95% reach can be delivering effective reach below 60%, and the headline number gives no indication of it.
What is a good average frequency for CTV?
Reporting broadly supports three to five exposures, with brand awareness campaigns tending higher and direct response campaigns lower, and with campaigns below two exposures underperforming substantially. The more useful framing is that average frequency is the wrong target. An average of three is consistent with a well-distributed campaign and with one where a tenth of households saw the ad eight times and a fifth saw it never.
Why does my cost per household reached keep rising?
Because reach does not scale with spend. Each additional impression is more likely than the last to land on a household already reached. Against a million-household universe at a $25 CPM, cost per thousand households reached rises from about $32 at 500,000 impressions to about $126 at five million, while the media CPM never changes. The impressions did not get more expensive, they got less useful.
How do I calculate a CTV universe estimate?
Start from your actual supply footprint rather than from a population figure, then apply audience definition. Adjust a geographic population for streaming penetration, then for ad-supported share since ad-free subscribers are unreachable at any price, then for the households actually available through the publishers you are buying. The supply adjustment is the one most often skipped and the one that most often explains a plan that looked fine and delivered poorly.
Does frequency capping reduce my reach?
It increases effective reach at constant spend. A cap does not delete surplus impressions, it redistributes them. An impression that would have been a household's seventh exposure goes instead to a household with one or none. Same budget, same impression count, more households above the threshold that matters. Capping is a yield improvement rather than a cost control, and it is one of the few available without any concession from the seller.
Why do per-publisher frequency caps not work?
Because they multiply. A cap of three applied inside each of six publishers permits a theoretical maximum of eighteen exposures for one household, since no publisher can see the others. The practical tail is shorter than eighteen and considerably longer than three, and the campaign reports an average that looks entirely healthy throughout. Only a shared household identifier applied across the whole buy caps the person rather than the placement.
Stay ahead of CTV and addressable TV
Get articles on streaming monetization, identity, and programmatic TV.
Subscribe + request demo →Head of CTV Product, LtvAdx
Related articles

CTV Geo-Targeting by IP: Whose Address Is It?
CTV country targeting rests on one IP lookup. It fails when the address is the SSAI server's, when IND meets IN, or when unknown counts as a match.

CTV Lift Tests: How Many Households You Need
A 10% lift on a 1% baseline needs 326,000 households split evenly, 906,000 with a 10% holdout, and about 2.5 million at 60% reach.

Whose Number Settles Your TV Guarantee?
A guarantee is a contract about a figure a third party produces later. With four certified currencies now in play, naming which one is the clause that matters.

CTV Ad Loudness: The Rule That Silences Spots
California's SB 576 extended loudness law to streaming on 1 July 2026. The failure mode is not a quieter ad. It is an ad that never runs at all.

Where Your CTV Ad Dollar Actually Goes
The ANA traced it: 36 cents of every programmatic dollar reached working media in 2023, about 45% by 2026. CTV is the fastest-growing and least efficient slice.
Co-Viewing: The One CTV Number Nobody Audits
Every party in a CTV transaction benefits when the co-viewing multiplier is larger. Nobody has a reason to audit it, and the errors offset.
Start trading TV
Ready to monetise CTV inventory?
See how LtvAdx fits your streaming and addressable TV setup — start free or book a walkthrough.
<10ms
VAST decision latency
p99 under 15ms — product specification
7-tier
HouseholdID graph tiers
UID2 · PPID · ADID · DeviceID · ACR · IP/24 · fingerprint
Illustrative platform metrics · System status