Most disputed numbers in advertising have someone standing on each side of them. A publisher wants delivered impressions counted high, a buyer wants them verified, and the tension between those two positions is what keeps the figure roughly honest.
Co-viewing has no such tension. The multiplier that converts household impressions into person impressions makes the reported audience larger, and every party in the transaction is better off when it does.
The publisher sells more delivered audience. The platform reports stronger campaign performance. The agency shows their client better reach against the same budget. The client sees a bigger number.
Nobody in that chain has a reason to argue it down. That is an unusual property for a number that materially determines what an advertiser pays per person reached, and this guide traces how the number gets made, what the real research says about its variance, and what to ask for instead.
Why CTV needs a multiplier at all
Start with why this exists, because the underlying problem is real and dismissing the multiplier entirely would be wrong.
On desktop and mobile, one impression is broadly one viewer. Those are personal devices held by one person.
A television is not. It is a shared device in a shared room, and it is watched socially far more often than any other advertising surface. A CTV ad server can confirm that a household received an impression. It cannot see how many people were on the sofa.
So the industry inherited a solution from broadcast: apply a co-viewing multiplier representing the average number of viewers per household exposure, derived from panel research, to convert household impressions into person impressions.
Advertisers buy demographics, not televisions. A campaign targeting adults 25 to 54 needs a person-level number. The multiplier is how that number gets produced.
Follow the number through five steps
The chain is deterministic for three steps and then it is not. Being precise about where the transition happens matters more than any single figure.
Step one: the ad is delivered to a device. A connected television requests an ad, the ad server responds, the creative plays, and beacons confirm playback. Logged, counted, verifiable. This is the foundation of every accountability claim CTV makes over linear, and the claim is fair.
Step two: the device resolves to a household. Identity resolution groups device identifiers into household units using IP signals, co-location patterns, account linkages where available, and probabilistic modelling with a confidence score. An inference enters here and it is a well-behaved one, with errors that are bounded and improvable. The mechanics are covered in household ID and identity in CTV.
Step three: the household impression is recorded. Deduplicated across that household's devices, this is the cleanest unit CTV produces. One household, one exposure, one record. If reporting stopped here it would be the most rigorous audience measurement television has ever had.
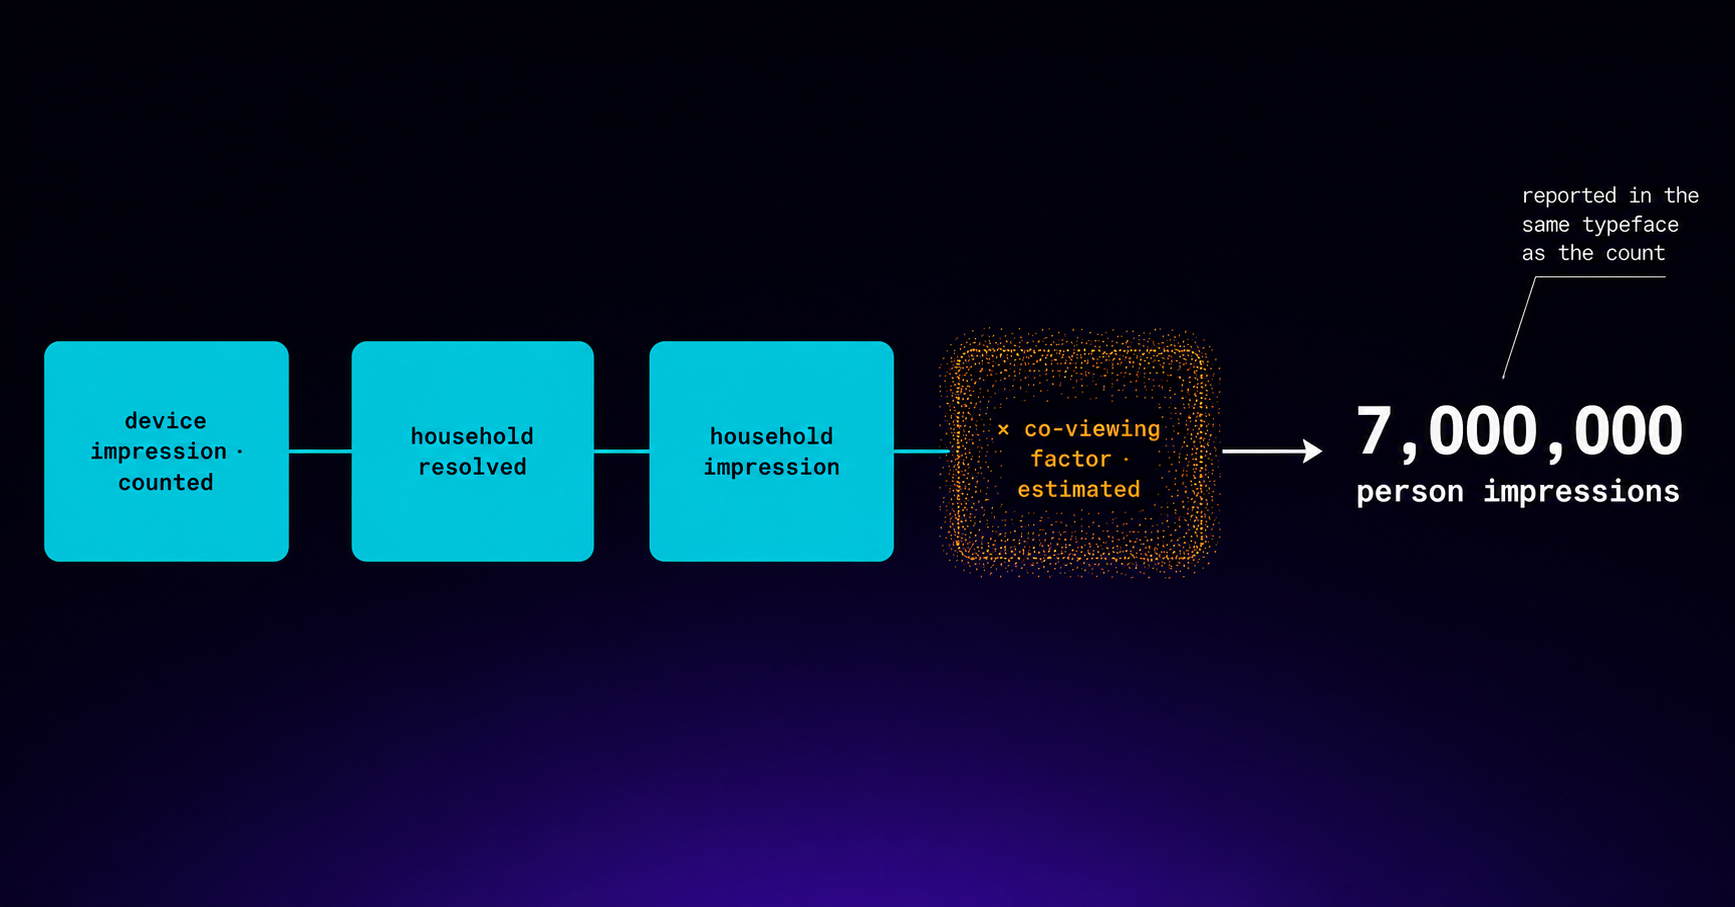
Step four: the multiplier is applied. The counted number is multiplied by a panel-derived estimate.
Step five: the product becomes the currency. The person-impression figure is what appears in the campaign report, what reach and frequency are computed from, and frequently what delivery guarantees settle against. An estimate has become the unit of account, layered on infrastructure specifically built to make counting possible.
Note what happened between steps three and five. A counted number was multiplied by an estimate, and the product is reported in the same column, in the same typeface, with the same apparent authority as the count that went into it.
What the research actually says about the range
Here is where the practice becomes quantifiably wrong rather than merely imprecise.
Published co-viewing research puts typical multipliers somewhere in the range of 1.3 to 1.9, with CTV averaging around 1.44 viewers per viewing household across a broad content mix.
But the variance within that average is the interesting part. Measurement work from TVision and others has found co-viewing running as low as roughly 1.1 for some streaming programming and as high as 1.9 for live sports.
That is not noise around a central value. That is a factor of nearly two between content types, driven by exactly what you would expect: sports and tentpole events are watched together, background streaming and catch-up viewing are watched alone.
Now consider that a commonly applied industry default sits around 1.2, applied uniformly across all CTV impressions regardless of content, daypart, or household composition.
A single number applied to a distribution that ranges from 1.1 to 1.9 is wrong nearly everywhere it touches. The question is only in which direction and by how much.
The offsetting errors that make aggregate reporting look fine
This is the part that keeps the practice alive, and it is worth working through with numbers.
Take a campaign delivering 5,000,000 household impressions, split 60% general streaming and 40% live sports. These are illustrative figures chosen to demonstrate the mechanism rather than to report a specific campaign.
The platform applies a uniform multiplier of 1.4 across everything. Reported: 7,000,000 person impressions.
Now compute it properly, using content-appropriate factors from the research range.
- Streaming: 3,000,000 household impressions × 1.15 = 3,450,000
- Live sports: 2,000,000 household impressions × 1.85 = 3,700,000
- True total: 7,150,000
The uniform multiplier produced 7,000,000 against a true 7,150,000. That is a 2.1% error in aggregate, which any reasonable person would call close enough.
Now look at the components.
- Streaming reported at 1.4: 4,200,000 against a true 3,450,000. Overstated by 21.7%.
- Sports reported at 1.4: 2,800,000 against a true 3,700,000. Understated by 24.3%.
The aggregate is nearly right and every component is wrong by more than a fifth, in opposite directions.
This is the worst possible failure shape. A visibly wrong total would get investigated. A total that reconciles cleanly while both halves are badly mispriced passes every check anyone runs, and it quietly corrupts every decision made below the total.
What the offsetting errors do to your budget
Follow the consequence, because this is where an accounting curiosity becomes money.
Your streaming inventory appears to deliver 21.7% more people than it does. Its cost per person reached looks lower than it is. Your optimiser sees efficient inventory and moves budget toward it.
Your sports inventory appears to deliver 24.3% fewer people than it does. Its cost per person looks higher. The optimiser reads that as expensive and moves budget away.
So a uniform multiplier does not merely produce inaccurate reporting. It produces a systematic budget shift away from the inventory that genuinely reaches more people per impression, toward the inventory that reaches fewer.
Live sports carries a CPM premium for reasons covered in the live sports advertising guide, and part of the justification for that premium is exactly the co-viewing effect the uniform multiplier erases. A buyer evaluating sports against streaming on person-impression cost, using a flat factor, is comparing the two on a basis that discards the sports inventory's main quantitative advantage.
The multiplier adds people. It does not check whether they are your audience.
This is the problem I find most under-discussed, and it undermines demographic buying specifically.
Targeting in CTV is applied at the household level. You buy adults 25 to 54, identity resolution determines which households plausibly contain them, and the ad serves to those households.
Then the multiplier converts one household impression into 1.85 person impressions.
Which persons? The multiplier does not say and cannot say. It is an average derived from panel research about how many people are typically in the room, not an observation of who was in this room.
In a live sports household delivering a 1.85 factor, those additional viewers might be two adults squarely inside your target. They might equally be one adult and one child, or an adult well outside the age band you bought.
The consequence is that a portion of your reported in-target person impressions were not verified as in-target. The household was qualified. The additional persons the multiplier credits you with were assumed into existence at the population average, then inherited the household's demographic classification.
This matters more the higher the multiplier goes, which means it matters most in exactly the content where co-viewing is strongest. Live sports gives you the largest uplift in reported person impressions and the weakest assurance that those additional persons match your buy.
It also compounds with any error in the household classification itself. If identity resolution assigned a household to your demographic segment with 80% confidence, and the multiplier then credits you with 1.85 persons from that household, the confidence attached to the additional 0.85 of a person is not 80%. It is 80% multiplied by an assumption about room composition that nobody measured.
None of this makes demographic CTV buying unsound. It means the person-level demographic delivery figure carries considerably more inferential distance from the underlying observation than its presentation suggests. Segment construction and its confidence characteristics are covered in the CTV audience segments guide, and the identity layer underneath in our identity implementation.
What co-viewing does to your conversion rate, in the wrong direction
Here is a consequence that runs opposite to every incentive described so far, and almost nobody notices it because reach metrics and efficiency metrics get examined separately.
The multiplier inflates your impression count. Conversions are not multiplied, because a conversion is a household-level event. One household buys the product once, regardless of how many people watched the advertisement.
So the multiplier inflates the denominator of your conversion rate while leaving the numerator alone.
Run it on the same campaign. 5,000,000 household impressions, reported as 7,000,000 person impressions, producing 10,000 conversions.
- Conversion per household impression: 10,000 ÷ 5,000,000 = 0.20%
- Conversion per person impression: 10,000 ÷ 7,000,000 = 0.14%
The identical campaign appears roughly 29% less efficient when measured on the person basis, purely because of a factor applied to make it look better on reach.
That is a genuine measurement artefact and it produces two specific errors.
Cross-channel comparison breaks. If you compare CTV conversion rate against display or paid social, you are comparing a multiplied denominator against an unmultiplied one. CTV loses that comparison by construction, before any real performance difference is considered. Anyone benchmarking channels this way is systematically penalising television for a convention that exists only in television. The comparison mechanics are covered in CTV versus digital video.
Performance optimisation moves the wrong way. Content with high co-viewing gets the largest denominator inflation, so it shows the worst apparent conversion efficiency, so an optimiser reduces spend on it. That is the same directional error as the budget shift described earlier, arriving through a completely different metric. Both push away from high co-viewing inventory. Performance measurement setup is covered in CTV for performance advertisers.
The correction is straightforward once you see it: compute conversion rates against household impressions, not person impressions. The conversion is a household event, so the denominator should be a household count. Person impressions are the right unit for reach and the wrong unit for efficiency, and using one number for both is where this goes wrong.
The unit mismatch nobody reconciles
There is a second problem sitting underneath the first, and it is structural rather than a question of estimate accuracy.
Frequency capping operates at the household level, because that is what identity resolution produces. A cap of three exposures per household per week is enforced against households, as covered in the frequency capping guide.
Reach and frequency reporting is in persons, because that is what the multiplier produces.
So a campaign capped at three household exposures, against a household carrying a 1.6 multiplier, reports 4.8 person impressions for that household. What was the frequency? Three, according to the enforcement layer. Something else, according to the reporting layer.
These are different units describing the same delivery, presented in the same report, never reconciled. A buyer reasoning about effective frequency is working with a number whose relationship to the cap they actually set is undefined.
It gets worse for reach. Unique households is a count. Unique persons is that count multiplied by an estimate, which means your deduplicated reach figure inherits the multiplier's error while looking like a deduplication.
Why nobody audits it
Return to the incentive, because it explains the persistence better than any technical account.
In linear television, panel-derived audience estimates had a genuine adversarial structure. Broadcasters wanted ratings high. Buyers wanted them verified. Both sides funded the measurement provider, and the provider's independence was the mechanism that made the number credible to both parties.
Co-viewing multipliers have no equivalent structure. The number benefits everyone who touches it. There is no party whose commercial interest is served by a smaller multiplier, which means there is no natural constituency for auditing it.
That is not an allegation that anyone inflates them deliberately. It is an observation that when a number can only be checked by someone with a reason to check, and nobody has a reason, the number drifts without anyone deciding to let it.
Compare this to the modelled reach figure sitting in an otherwise counted CTV report, which has at least one constituency — buyers — who benefit from correction. Co-viewing does not, which is why I expect it to be the last of the panel-era conventions to get fixed.
What better reporting looks like
Four changes, none of which require new measurement technology.
Report household and person impressions as separate lines, always. One is counted, one is derived. A buyer who sees both can reconcile the counted figure exactly and negotiate about the derived one. A buyer who sees only the product can do neither. Reporting structure is covered in the CTV reporting and analytics guide.
State the multiplier and its source. Which factor was applied, derived from which research, updated when. This is one field, and its absence is currently normal.
Vary the multiplier by content type at minimum. Given a documented range from roughly 1.1 to 1.9 across content categories, applying one number to all of it is the single largest correctable error in the chain. Content-level factors are available and the reporting convention simply predates their availability.
Let buyers substitute their own factor. An advertiser with research on household composition for their specific target should be able to apply it and see the campaign recomputed. If two reasonable multipliers produce materially different answers, that difference is information the buyer should have rather than a decision the platform should make silently.
What to ask your supplier
Three questions, in order of how much they reveal.
What co-viewing multiplier was applied to this campaign, and where did it come from? The answer, or the difficulty of obtaining one, tells you a great deal about the rest of the reporting. A supplier who can name the factor and its source is running a more careful operation than one who cannot.
Was it uniform across content types? If yes, and your buy spans sports and general streaming, your component-level numbers are wrong in both directions regardless of how the total looks.
Can you report household impressions separately? This is the one that matters most, because it is the counted number. A supplier who reports it alongside the person figure is giving you something you can verify. One who reports only the product is asking you to accept an estimate as a measurement.
These sit naturally alongside the other diligence questions in the programmatic TV buying checklist.
Frequently asked questions
What is a co-viewing multiplier in CTV?
It is a factor applied to household-level impression counts to estimate person-level impressions, accounting for the fact that television is watched by more than one person at a time. Published research puts typical values between roughly 1.3 and 1.9, with CTV averaging around 1.44 viewers per viewing household across a mixed content diet.
Why does co-viewing vary so much between content types?
Because viewing behaviour genuinely differs. Live sports and tentpole events are social occasions watched together, producing factors approaching 1.9. Background streaming, catch-up viewing, and daytime consumption are frequently solitary, producing factors as low as around 1.1. Applying a single number across both misprices each of them.
Is a household impression or a person impression the more useful metric?
Household impressions are more reliable because they are counted rather than estimated. Person impressions are more relevant to how advertisers define targets, since campaigns are bought against demographics rather than against televisions. The correct answer is to report both separately and label which is which, rather than choosing one and hiding the derivation.
Does co-viewing affect frequency capping?
It creates a unit mismatch. Frequency caps are enforced at the household level, because that is what identity resolution produces. Frequency is then reported at the person level, because that is what the multiplier produces. A three-exposure household cap with a 1.6 factor reports 4.8 person impressions, and the relationship between the enforced cap and the reported figure is undefined.
Should I stop trusting person-impression reporting?
No, but treat it as an estimate rather than a count, and ask what factor produced it. The underlying research is legitimate and ignoring co-viewing entirely would understate television's delivered audience, which is a worse error than estimating it imperfectly. The problem is presenting a counted number and an estimated number as though they are the same kind of thing.
Should I compute conversion rate on household or person impressions?
Household impressions. A conversion is a household-level event, since one home buys the product once regardless of how many people watched the ad. Dividing household conversions by person impressions inflates the denominator without touching the numerator, which makes the campaign look roughly a third less efficient than it is and penalises high co-viewing content specifically. Person impressions are the right unit for reach and the wrong unit for efficiency.
Does this apply to linear TV as well as CTV?
Linear has always used co-viewing multipliers and has always been transparent that its audience figures are panel-derived estimates, because nothing about broadcast could be counted directly. Nobody mistakes a linear rating for a census. The CTV problem is different in kind: the delivery data underneath genuinely is counted, so an estimate applied on top inherits an authority it did not earn. Linear was honest about being an estimate. CTV presents a product of a count and an estimate as though the whole chain were counted.
How would I verify a multiplier independently?
Realistically you cannot verify it directly without your own panel, which is why the practical route is comparison rather than verification. Ask several suppliers what factor they applied to comparable inventory. Wide divergence between them on similar content is informative, and convergence on a suspiciously round number applied uniformly is informative in a different way.
See the counted number alongside the estimate
LtvAdx reports household-level delivery as a separate line from person-level estimates, with the applied factor stated, so you can reconcile what was counted and negotiate what was derived.