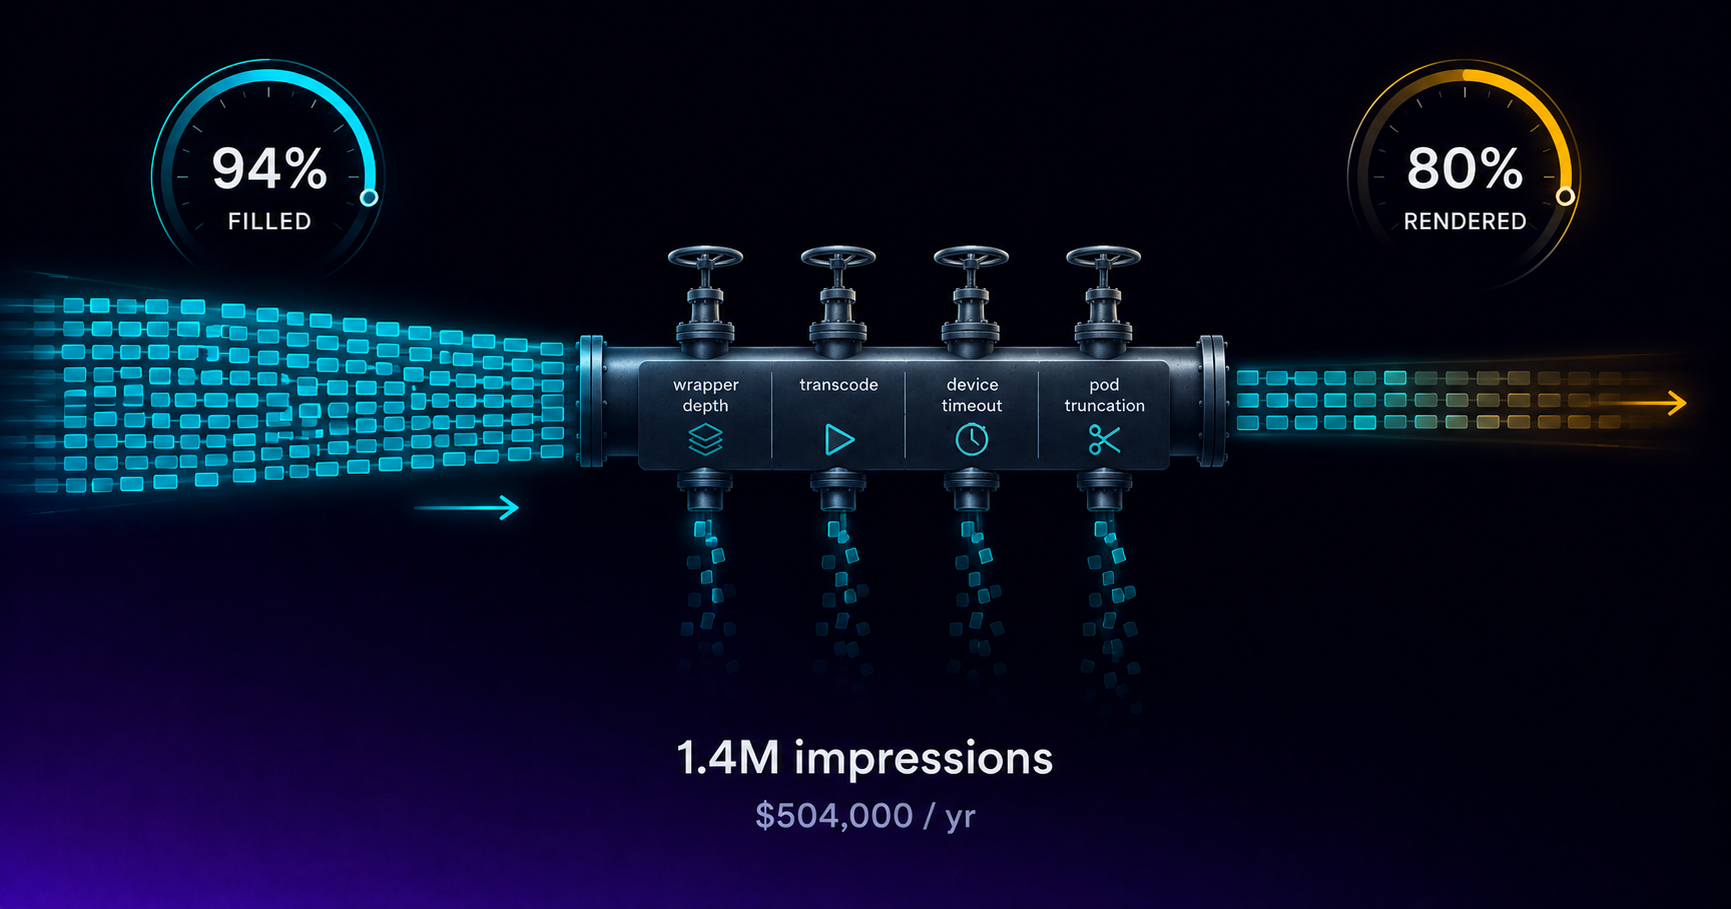
Fill rate measures whether an ad was returned in response to a request. It says nothing about whether that ad ever played on a screen. Those are two different events, separated by a chain of technical steps that fails more often than most publishers realise, and the gap between them is the largest source of unmeasured CTV revenue loss I have seen in publisher operations.
Most publishers never measure the gap, because the two numbers live in different systems. Fill rate comes from the ad server. Rendered impressions come from the player or the SSAI layer. Nobody reconciles them, and a 94% fill rate quietly becomes 80% of the revenue it implies.
This guide covers the three states a CTV ad opportunity passes through, the four failure modes that kill a returned ad before it plays, how to run the reconciliation, and why weighting your waterfall on bid price alone selects for the wrong demand partners.
Three numbers, and most publishers track one
A CTV ad opportunity passes through three distinct states, and each has its own failure mode.
Bid rate. The share of ad requests that received at least one valid bid. Failures here are demand-side: no eligible buyer, floor price set above what the market will pay, targeting mismatch. This is a pricing and demand problem, and it is well covered — the mechanics sit in FAST channel yield optimization.
Fill rate. The share of requests where an ad was successfully returned to the player or the stitcher. This is the number on the dashboard, the number in the QBR, and the number publishers optimise against.
Render rate. The share of returned ads that actually fired an impression beacon, meaning the creative genuinely played. This is the number that correlates with revenue you can collect and keep.
Publishers optimise the middle number. They get paid on something closer to the third.
It is worth being precise about why this surprises people. A common assumption — repeated in a lot of CTV measurement writing — is that CTV impressions are inherently reliable because they are tied to actual playback on a television, unlike web display where a pixel can fire without anything being seen. The first half of that is true. The second half quietly assumes the ad reached the player intact, and that assumption is where the money goes.
Where a returned ad dies before it plays
Four failure modes account for most of the gap. All four are diagnosable, and three are fixable by the publisher without any change in demand.
VAST wrapper chains that exceed the timeout
A demand partner returns a VAST wrapper, which redirects to another wrapper, which redirects to the actual creative. Each hop is a network round trip. A three or four hop chain — common with resold inventory passing through multiple intermediaries — can consume the entire ad decisioning window before the creative URL is ever reached.
The ad server logs a fill. The viewer sees slate or a black frame. This is the single most common cause of the gap, and it correlates strongly with supply path length, which is one more argument for the consolidation logic in supply path optimization.
You can inspect wrapper depth on a live response directly with the VAST inspector, and validate structural conformance with the VAST validator.
Creative transcode and format mismatches
The returned creative does not match the bitrate ladder, codec profile, or container format the stream requires. SSAI stitching fails, and the platform substitutes slate or drops the slot.
This is more common than it should be because creative specifications are frequently treated as advisory. A creative that plays fine in a browser preview can fail stitching against an HLS ladder that expects specific segment alignment. Requirements are covered in CTV creative best practices and the standard itself in the VAST 4.2 guide.
Device-level timeout on constrained hardware
Older smart TVs and budget streaming sticks have meaningfully less processing headroom and slower network stacks than current-generation hardware. A creative and wrapper chain that resolves comfortably on a modern device times out on a five-year-old TV.
Device-level render variance is real, frequently large, and almost never segmented in standard reporting. If you have never broken render rate out by device type and OS version, that single cut usually explains a surprising share of the gap.
Pod truncation
A pod declares three slots and fills all three, but the break ends early — the live content resumes, or the player advances — and slot three never plays. On-demand content does this occasionally. Live content does it constantly, because break duration is signalled rather than guaranteed.
This is why render rate by pod position is a required cut. A systematic drop at position three is a break-detection problem, not a demand problem, and it calls for pod construction changes rather than pricing changes. Pod design is covered in ad pod strategy, and you can model the effect of different pod configurations with the ad pod fill simulator.
The arithmetic
Run this on an illustrative mid-size CTV publisher. These are modelled figures chosen to show the shape of the problem, not measured results from a specific publisher.
Ten million ad requests per month. Reported fill rate of 94%, so 9.4 million ads returned. Rendered impressions, measured at the player: 8.0 million.
The gap is 1.4 million ads counted as filled that never played — 14.9% of filled inventory.
At a $30 CPM, that is $42,000 per month, or roughly $504,000 a year, in inventory the publisher's own dashboard reports as successfully monetised.
Whether that revenue was actually billed and then disputed, or never billed at all, depends on the contract and the measurement source of truth. Either outcome is bad: billed-then-disputed produces makegoods and reconciliation disputes, while never-billed is straightforward lost revenue. The reconciliation exposure specifically is what makes this worth fixing before it becomes a commercial conversation.
Why this corrupts your waterfall
The gap does not distribute evenly across demand partners, and that is what turns a measurement problem into a yield problem.
A demand partner returning a single-hop VAST response with correctly formatted creative renders reliably. A partner returning a four-hop wrapper chain with a creative that occasionally fails transcode renders considerably worse. In a fill rate report, these two partners look identical — both filled the request.
Now weight your waterfall on bid price, which is what a standard price-priority configuration does.
- Partner A bids $32 and renders 78% of the time. Realised revenue per thousand: $24.96.
- Partner B bids $28 and renders 96% of the time. Realised revenue per thousand: $26.88.
The lower bid is worth more. A price-priority waterfall picks the wrong one every single time, and it will keep picking it, because nothing in the fill rate report contains the information needed to know better.
The fix is to weight on render-adjusted eCPM rather than bid CPM — and to compute it per partner and per device cohort rather than in aggregate, because the same partner can render acceptably overall while failing badly on one TV OS or during live pods. Aggregate figures hide exactly the cases that matter. Waterfall priority mechanics are covered in CTV header bidding.
The billing exposure this creates
A render gap is not only a yield problem. It is a contractual one, and it usually surfaces as a discrepancy dispute months after the flight.
Most insertion orders specify whose measurement governs and set a discrepancy threshold — commonly, differences under some percentage are absorbed and anything above triggers reconciliation. That structure works when both sides are counting roughly the same event. It breaks when the publisher counts fills and the buyer counts rendered impressions, because the gap is not noise, it is systematic and it always runs the same direction.
Buyer-side measurement in CTV increasingly counts rendered impressions, which means a publisher billing on fills is billing a number their counterparty will not recognise. The discrepancy is then discovered by the buyer, disputed after delivery, and settled at the publisher's expense — with the relationship cost on top.
This becomes acute on guaranteed deals. Under programmatic guaranteed, committed impression volume carries makegood obligations if it under-delivers. A render gap is invisible under-delivery: the publisher believes the commitment was met, the buyer's measurement says it was not, and the makegood lands in the next flight at the publisher's cost.
Two practical protections. Align your billing basis with rendered impressions before a dispute forces it, and state the measurement source of truth explicitly in the IO rather than relying on a default. Both are easier to negotiate before a discrepancy exists than after one.
Not rendered versus rendered but not measured
This distinction is the one most likely to send a diagnosis in the wrong direction, and SSAI is where it blurs.
A render failure means the ad genuinely did not play. The viewer saw slate, black, or content resuming early. This is a delivery problem, and the remediation is technical: shorten wrapper chains, fix creative specs, adjust timeout budgets, correct pod construction.
A measurement failure means the ad played correctly and the impression beacon did not fire or did not arrive. This is an instrumentation problem, and the remediation is completely different: fix beacon configuration, check firing responsibility between the stitcher and the player, verify network egress from the beacon endpoint.
Both appear identically in a fill-to-impression reconciliation. Confusing them means rewriting creative specifications to solve what was a beacon configuration issue, or the reverse.
The diagnostic is to check whether anything downstream fires. If start or first-quartile beacons arrive with no impression beacon, the ad played and the measurement gap is instrumentation. If nothing at all arrives after stitch confirmation, it is a genuine render failure. This is easier to test than to reason about — the SSAI beacon tester fires a full sequence against your endpoint and reports what arrives.
Under server-side insertion the ambiguity is worse, because the stitcher may fire the impression beacon on stitch rather than on playback confirmation. That inflates measured impressions relative to actual plays, which is the opposite error and equally worth knowing about. How the beacons flow in a server-side setup is covered in SSAI explained and in our SSAI implementation.
How to run the reconciliation
This is a one-week engineering exercise for most publishers, not a quarter-long project.
Pull two datasets for the same seven-day window. From the ad server: every ad response logged, keyed by auction or request ID, with demand partner, creative ID, pod position, device type, and content ID attached. From the player or SSAI layer: every impression beacon that actually fired, keyed by the same identifier.
Left join the first onto the second. Every ad server row with no matching impression beacon is a filled-but-unrendered ad. That count over total fills is your render gap.
Three practical warnings.
The join key has to survive the SSAI boundary. Some stitchers generate a new internal identifier and do not propagate the original auction ID. If that happens, the join fails silently and your gap looks like 100%. Confirm the identifier is preserved end to end before trusting any output.
Allow a window for late beacons. Impression beacons from constrained devices can arrive several seconds after playback starts. A join run tightly against timestamp will misclassify legitimate renders as failures.
Exclude legitimate viewer abandonment where you can. A viewer who exits the app mid-break produces a filled, unrendered ad through no infrastructure fault. That is real churn, not a technical failure, and no amount of engineering converts it to revenue. It sets a floor on how far the gap can be closed.
The four cuts that turn the number into action
A single aggregate render rate tells you a problem exists. These four segmentations tell you what to fix.
- By demand partner. Surfaces wrapper chain problems immediately and gives you the input for render-adjusted waterfall weighting.
- By device type and OS version. Render failures cluster hard on older hardware. If a device class fails systematically, either creative requirements or timeout budgets need adjusting for it specifically.
- By pod position. A drop at later positions indicates truncation and points at break detection rather than demand.
- By creative. A single misencoded creative from a large campaign can drag a month's render rate down on its own, and it is trivially fixable once identified.
Sort the unmatched rows by demand partner first. In most cases a small number of partners account for a disproportionate share of the gap, and those are usually the ones with the longest wrapper chains. That single sort typically pays for the whole exercise.
What the gap looks like across a real waterfall
Aggregate numbers hide the thing you need to see. Here is the same publisher's inventory broken out by demand partner, using illustrative figures constructed to show the pattern rather than data from a specific platform.
- Partner A — direct integration, single-hop VAST. Fill 91%, render 97%, bid $26. Realised: $25.22.
- Partner B — SSP, two-hop wrapper. Fill 95%, render 93%, bid $29. Realised: $26.97.
- Partner C — reseller path, four-hop wrapper. Fill 96%, render 74%, bid $34. Realised: $25.16.
- Partner D — SSP, mixed creative quality. Fill 89%, render 81%, bid $31. Realised: $25.11.
On fill rate and bid price — the two numbers a standard waterfall reads — Partner C is the clear leader. It fills most reliably and pays the most. A price-priority configuration gives it top position.
On realised revenue it drops to third, behind a partner bidding $8 less than it does. The four-hop wrapper chain is eating roughly a quarter of everything it wins.
The spread between the best and worst realised eCPM here is under $2, which is small enough that it never triggers attention in a monthly revenue review. Across ten million monthly requests it is real money, and more importantly the ranking is inverted — the waterfall is systematically preferring the worst-performing partner because the metric it reads does not contain the relevant information.
Note also that fill rate and render rate move independently. Partner D has the lowest fill and a middling render. Partner C has the highest fill and the worst render. There is no shortcut that lets you infer one from the other, which is precisely why both have to be measured.
What to change once you have the number
Reweight the waterfall on render-adjusted eCPM. This is the highest-value change and it requires no partner negotiation. Compute realised revenue per thousand rather than bid price, per partner and per device cohort.
Set a wrapper depth limit. Reject responses exceeding two or three hops. You will lose some fills and gain render rate, and the net is usually strongly positive.
Tighten creative specifications and enforce them. Specifications that are not validated on ingest are suggestions. Validate at the point creative enters the system.
Take render rate to your partners with data. A demand partner shown their own render rate against the platform average will usually engage, because it affects their delivery too. This conversation is far easier with a per-partner number than a general complaint.
Adjust pod construction for live inventory. If position three truncates systematically during live content, either shorten the pod or reorder so that lower-value creative sits in the position most likely to be cut. Live break behaviour is covered in live sports advertising.
Where this framing has limits
Some of the gap is not recoverable. Viewer abandonment is real and no instrumentation converts it into revenue. Chasing render rate to 100% eventually means chasing measurement artefacts rather than fixing delivery.
Render measurement is itself imperfect. A fired beacon does not guarantee a genuinely viewed ad, particularly in server-side environments where the stitcher fires on its own schedule. Render rate is a much better proxy than fill rate. It is not truth.
Scale determines whether this is worth doing. At 200,000 monthly requests, the same 15% gap is roughly $900 a month — worth knowing about, not worth a quarter of engineering time. The threshold where this becomes the highest-value instrumentation available sits somewhere around a few million monthly requests. Above that, the gap is almost always larger than any pricing optimisation elsewhere in the stack.
Frequently asked questions
Is render rate the same as viewability?
No. Render rate asks whether the ad played at all. Viewability asks whether a played ad met a standard for being seeable — on screen, audible, for a minimum duration. An ad can render fully and still fail viewability, and viewability measurement assumes rendering as a precondition. The CTV viewability standards are covered separately in the viewability standards guide.
What is a healthy CTV render rate?
There is no universal benchmark worth quoting, because the number depends heavily on device mix, live versus on-demand share, and supply path length — all of which vary enormously between publishers. The useful comparison is against yourself: measure it, segment it, and track whether it improves. A publisher moving from 82% to 91% has captured real revenue regardless of where the industry average sits.
Should I bill on fills or on rendered impressions?
Rendered impressions, wherever the contract allows it. Billing on fills creates reconciliation disputes when the buyer's own measurement disagrees, and buyer-side measurement increasingly counts rendered impressions. Aligning your billing basis with the buyer's measurement basis removes a category of dispute entirely. Reporting structure is covered in reporting.
Does SSAI make the gap better or worse?
Better on delivery, harder on measurement. Server-side insertion is considerably more resistant to the client-side failures that cause render loss, so the genuine render gap tends to be smaller. But it obscures the distinction between not rendered and rendered-but-not-measured, because the stitcher sits between the ad server and the player and may fire beacons on its own logic. You trade delivery reliability for measurement ambiguity.
How do I raise this with a demand partner without damaging the relationship?
Lead with the data and frame it as a shared problem, because it genuinely is — their delivery suffers too. Show their render rate against the platform average, segmented by device where the gap concentrates. Most partners will investigate. A partner who refuses to engage with a documented render rate problem has told you something useful about how to weight them.
Where does this sit relative to invalid traffic?
They are adjacent and distinct. Invalid traffic is inventory that should never have been transacted. The render gap is legitimate inventory that was transacted and failed to deliver. Both cause billed impressions that produced nothing, which is why they get conflated, but the remediation is entirely different — filtering versus engineering. Fraud specifically is covered in CTV ad fraud and SSAI spoofing.
See what your inventory actually renders
LtvAdx reports delivery at the beacon level with per-partner, per-device breakdowns, so the gap between filled and rendered is visible rather than inferred.