Where Your CTV Ad Dollar Actually Goes
The ANA traced it: 36 cents of every programmatic dollar reached working media in 2023, about 45% by 2026. CTV is the fastest-growing and least efficient slice.

The ANA and PwC took the question seriously enough to trace it. Their 2023 programmatic supply chain study concluded that around 36 cents of every advertiser dollar reached working media. Two years of scrutiny later, the ANA's 2026 benchmark reports that figure improved to roughly 45%, with the share reaching publishers up around eleven points since 2023.
Real progress, and still under half. The question worth asking is not whether the number is embarrassing. It is where the other fifty-five cents goes, because the categories behave very differently and only some of them are fees.
CTV has a specific reason to care. It now accounts for a large and rapidly growing share of programmatic spend, having jumped from roughly 30% to over 44% of tracked spend in the ANA's data, and it does so with lower media productivity than the programmatic average. The fastest-growing channel is also one of the least efficient, and the gap is widening rather than closing.
The waterfall, category by category
The 2023 study broke the missing 64% into components. They are worth listing individually because the response to each is different, and lumping them together as "the ad tech tax" obscures the fact that most of it is not tax at all.
$1.00  advertiser spend
 -0.10  DSP fees
 -0.13  SSP fees
 -0.06  data and targeting costs
 -0.10  made-for-advertising inventory
 -0.095 non-viewable impressions
 -0.15  non-measurable impressions
 -0.005 confirmed invalid traffic
 ─────
 $0.36  working media
Read that column again and notice the split. Explicit fees, the DSP and SSP lines plus data, come to about 29 cents. The remaining 35 cents is not paid to anyone. It is spend that bought something with no value: inventory nobody meaningfully saw, inventory nobody could verify, inventory built to absorb budget.
That distinction is the whole strategy. Fee compression is a negotiation, and it has a floor, because the parties charging fees are performing work. Waste elimination is an operational change with no floor, and it is the larger number.
Most advertisers spend their transparency energy on the smaller half.
What CTV changes about each line
The categories do not transfer to CTV unchanged. Some shrink to almost nothing, some get worse, and one is a different problem entirely.
Made-for-advertising inventory: smaller, but not zero
MFA in display means a site built purely to carry ads. The CTV equivalent is a FAST channel with negligible genuine audience, monetised through automated distribution rather than through anyone choosing to watch it.
The scale is lower than in display because launching a channel is harder than launching a website. It is not zero. Channel proliferation across FAST platforms has produced a long tail where the distinction between a small niche channel and an audience-free one is not visible from a bid request. What separates them, and how yield actually behaves on legitimate small channels, is covered in FAST channel yield optimization.
Viewability: a category error in CTV
Display viewability asks whether pixels were on screen. That question barely applies to a full-screen, non-skippable ad on a television.
The CTV version of the question is different and harder: was the television on, was anyone in the room, and did the ad render at all after being counted as filled. We have written about the last of those in fill rate versus rendered impressions, and about the standards question in CTV viewability standards.
The practical consequence: importing a display viewability number into a CTV plan measures the wrong thing and produces false comfort. The waste is real, it is just not the waste that metric detects.
Non-measurable: the worst line in CTV
Fifteen cents was the largest single component in the 2023 study, and CTV structurally makes it worse.
Server-side ad insertion exists to defeat ad blocking and to deliver broadcast-quality streams without buffering. It works. It also means the ad is stitched into the video before it reaches the device, so third-party measurement tags have no browser to run in and no client-side context to report from.
Everything downstream depends on beacons the server fires on the client's behalf, which is a weaker attestation than a tag executing in an environment the measurement vendor controls. The mechanics are in server-side ad insertion explained.
So the medium with the highest CPMs is also the one where independent verification is hardest. That is not an accident and it is not a scandal. It is a direct consequence of a delivery architecture chosen for good reasons, and it means CTV buyers need a different verification posture rather than a stricter version of the display one.
Invalid traffic: small in the study, structurally different here
Half a cent looks negligible, and the number is specifically confirmed invalid traffic, which is a floor rather than an estimate.
CTV has fraud patterns display does not: spoofed device identifiers, server-side beacon replay, and unauthorised stitching that presents datacenter traffic as household viewing. The detection approach that works, and the reason the confidence level of a signal has to determine whether it can move money, is in CTV ad fraud and IVT detection.
Fees: more hops than display
This is where CTV is straightforwardly worse rather than merely different.
A display impression typically passes through a DSP and an SSP. A CTV impression can pass through a DSP, an SSP, a device-level or platform-level intermediary, an SSAI vendor, and a content aggregator, each with a position in the chain and a rate.
None of those parties is doing nothing. They each perform a function. The problem is that no participant can see the whole chain, so nobody can tell whether the cumulative take is 20% or 50%, and every party is honestly able to say their own margin is reasonable. Supply path work is the standard response and it is covered in CTV supply path optimization.
Principal buying, where the fee is not a fee
One structure deserves separate treatment because it does not appear as a fee anywhere.
In an agency or intermediary model, a party charges a stated percentage and passes the rest through. In a principal model, the party buys inventory on its own account and resells it to you at a price it sets. The difference between what it paid and what you paid is its margin, and that margin is not a line item in any report you receive. It is the spread.
This is legal, it is disclosed in contracts, and it is not inherently unreasonable, since taking inventory onto your own book carries real risk. What it is not is visible. A supply chain audit that adds up disclosed fee percentages will conclude your take rate is modest while a principal position sits underneath, invisible, potentially larger than every disclosed fee combined.
The diagnostic question is not "what is your fee." It is "are you acting as an agent or as a principal on this inventory, and if principal, what did you pay for it." The first half of that question gets a straight answer far more often than the second.
Two things that quietly make it worse
Resold inventory, counted twice
The same avail can be offered by several intermediaries. A buyer running one campaign through two paths that both terminate at the same publisher pays two sets of intermediary fees for one impression, and frequently bids against themselves in the process.
This is visible in the data if anyone looks, because the publisher is the same at the bottom of both paths. It is rarely looked at, because the reporting each intermediary provides describes its own path and stops there. Deal structures that pin the path explicitly, discussed in CTV deal ID mechanics, are the usual remedy.
Frequency waste, which is not in the study at all
The ANA framework measures whether a dollar reached working media. It does not measure whether the working media was useful.
In CTV, the seventh impression on the same household in one evening is fully working media by the study's definition. It arrived, it rendered, it was viewable, it was human. It also did nothing, and past a certain point it actively damages sentiment.
Because frequency management across publishers is genuinely hard without shared identity, this waste is common and completely invisible in efficiency accounting. The methods available are in CTV frequency capping, and the identity foundation they depend on is in household ID and identity.
Add it to the waterfall and the working-media figure gets worse rather than better. It is arguably the largest uncounted line in the whole exercise.
Tracing one campaign
Abstract percentages are easy to nod at. Put a number on it.
A $500,000 CTV flight, bought programmatically across a mixed publisher set. Apply the 2023 study's categories, which is pessimistic given the improvement since, and generous given that CTV underperforms the average:
$500,000  committed
 -50,000  DSP
 -65,000  SSP
 -30,000  data
 -50,000  MFA / low-quality supply
 -47,500  non-viewable
 -75,000  non-measurable
  -2,500  confirmed IVT
 ────────
$180,000  working media
Now subtract what the framework does not count. If cross-publisher frequency is unmanaged and a fifth of delivered impressions land beyond a useful exposure ceiling, another $36,000 of that $180,000 bought nothing. Call it $144,000 of the original half million doing commercial work.
The instinct on seeing this is to renegotiate the DSP and SSP lines. Together they are $115,000, and a hard-fought negotiation might recover a fifth of that. Twenty-three thousand dollars.
The waste lines, excluding fees entirely, are $175,000. Path consolidation and frequency management do not require anyone's agreement, and they address the larger number. That is the whole argument for the ordering in the section above, expressed in dollars rather than principle.
What actually recovers money
In descending order of return, which is close to the reverse of where most attention goes.
1. Cut the number of paths. Most CTV budgets flow through more intermediaries than anyone intended, because paths accumulate and nobody removes them. Consolidating to the shortest route to each publisher removes stacked fees and duplicate bidding at once. This is the largest single recovery available to most buyers and it requires no negotiation with anyone.
2. Buy direct where volume justifies it. A publisher representing a meaningful share of your delivery should be a direct relationship. Programmatic guaranteed keeps the automation and removes the auction layer. The economics of when this is worth the operational overhead are in upfront versus programmatic.
3. Fix frequency before touching fees. Household-level capping across your whole buy typically recovers more than a fee negotiation will, and unlike a fee negotiation it improves the campaign rather than just its cost.
4. Ask for log-level data and act on what it shows. Impression-level detail is what makes duplicate paths and frequency concentration visible. Where it is unavailable, that is information about the path rather than a neutral fact. What to expect is in CTV reporting and analytics.
5. Then negotiate fees. Last, not first, because it is the smallest lever, the most adversarial, and the one with a hard floor.
Why buyers cannot see this
It is tempting to read the numbers as evidence of bad actors. Mostly they are evidence of an architecture where no participant holds the full picture.
Every party reports its own segment. A DSP reports what it spent and what it charged. An SSP reports what it received and what it paid out. Neither reports what happened on the other side of itself, because neither can see it. Stack five such parties and you have five accurate reports and no total.
The reports do not share keys. Reconciling them requires a common impression identifier that survives every hop. In practice identifiers are rewritten at boundaries, which makes joining the reports a manual exercise rather than a query, and manual exercises do not happen quarterly across hundreds of publishers.
Aggregate reporting hides the shape. Duplicate paths and frequency concentration are properties of the distribution, not the average. Both vanish entirely at the summary level, which is the level almost all reporting is delivered at.
Nobody in the chain is incentivised to build the join. Each participant's margin looks defensible in isolation, and it usually is. The problem is only visible in aggregate, and no participant benefits from making the aggregate legible.
That is a structural explanation rather than an excuse. It does mean the fix is a reporting decision by whoever sits closest to the exchange, rather than a moral one. The market shape that produces it is described in the CTV ad networks guide.
The question to ask a partner
One question separates supply chains that can be reasoned about from ones that cannot:
For a given impression, can you tell me every party that took a position between my budget and the publisher, and what each one took?
Most cannot answer. Some cannot answer because they do not know, which is the honest version and worth hearing. Some cannot answer because their commercial model depends on you not knowing.
The distinction matters and it is detectable. A partner who does not know will tell you what they do know and where their visibility ends. A partner whose model depends on opacity will redirect to performance metrics.
Our position is that the answer should be a report rather than a conversation. Every impression served through our exchange carries the deal type, the path, and the fee structure applied to it, visible in reporting rather than available on request. The product tour covers how the auction and the waterfall priority actually resolve.
The publisher side of the same number
Everything above is written from the buyer's chair. The publisher sitting at the other end has a mirror-image problem and rather less attention paid to it.
If 45 cents of the advertiser's dollar reaches working media, the publisher receives some portion of that 45 cents, not of the dollar. A publisher quoting a $30 net CPM has no visibility into whether the buyer paid $40 or $70 to deliver it, which means they cannot tell whether they are priced competitively or whether an intermediary is capturing the difference.
Two consequences follow, and both are worth acting on.
You are being compared on a number you did not set. A buyer evaluating your inventory sees the delivered cost, not your rate. If three intermediaries sit between you, your excellent net price can present as expensive inventory and lose the renewal for reasons nobody will explain to you.
Shortening your own paths raises your effective rate without raising your price. Every intermediary removed between you and demand is margin that stays in the transaction, and the buyer sees a lower delivered cost for the same inventory. Both sides gain and neither has to concede anything. The mechanics of running direct and guaranteed demand alongside open auction are in FAST channel monetization, and the priority logic that decides which wins is set out in how CTV ad serving works.
The publishers who will do well as buyer scrutiny reaches CTV are the ones who can already say, on request, exactly who sits between them and each buyer. That is a reporting capability rather than a commercial concession, and it is currently rare enough to be a differentiator.
Why this is getting more urgent
CTV's share of programmatic spend rose from roughly 30% to over 44% in the ANA's tracking, and its media productivity sits below the programmatic average. Those two facts together describe a market where the efficiency gap grows with every dollar that moves into it.
The overall improvement from 36% to around 45% working media is genuine and it came from advertisers applying pressure. That pressure was applied mostly to display, where the measurement infrastructure to apply it already existed. CTV has been growing through the same period with less scrutiny, weaker verification, and more intermediaries.
The reasonable expectation is that the same correction arrives here, driven by the same people, over the next few years. Publishers and platforms that can already answer the path question will find that a straightforward conversation. The ones that cannot will find it expensive.
If you want to see what full path disclosure looks like on a real buy, get in touch, or start with the programmatic TV buying checklist.
Frequently asked questions
How much of a CTV ad dollar actually reaches the publisher?
The ANA and PwC found roughly 36 cents of every programmatic dollar reached working media in their 2023 study, improving to around 45% by the ANA's 2026 benchmark, with the share reaching publishers up about eleven points over that period. CTV specifically shows lower media productivity than the programmatic average while accounting for a growing share of spend, so the channel figure is likely below the blended one rather than above it.
Is the missing money all fees?
No, and this is the most useful thing to understand about the breakdown. Of the roughly 64 cents that did not reach working media in the 2023 study, explicit fees for DSP, SSP, and data accounted for about 29 cents. The remaining 35 cents was waste rather than payment: non-viewable inventory, non-measurable inventory, made-for-advertising sites, and invalid traffic. Nobody received that money in exchange for a service, which means eliminating it does not require anyone to accept a lower margin.
Why is CTV less efficient than other programmatic channels?
Three structural reasons. The supply chain has more hops, since a CTV impression can pass through device platforms, SSAI vendors, and content aggregators in addition to the usual DSP and SSP. Server-side insertion makes independent measurement harder, inflating the non-measurable category. And frequency waste is severe and largely uncounted, because managing frequency across publishers requires shared identity that often is not present.
What is the fastest way to recover wasted CTV spend?
Reduce the number of supply paths reaching each publisher. Most budgets accumulate paths over time without anyone removing them, producing stacked intermediary fees and self-competing bids on identical inventory. It requires no negotiation, it is visible in log-level data, and for most buyers it recovers more than a fee negotiation would. Fixing cross-publisher frequency is usually second, and fee negotiation comes last.
Does supply path optimization actually work in CTV?
Yes, though it works differently than in display. The gains come less from choosing a cheaper route to the same impression and more from eliminating duplicate routes to the same publisher, because CTV inventory is frequently offered by several intermediaries at once. Verifying that a path terminates where you think it does matters more than shaving basis points off any single hop.
Should I ask for log-level data?
Yes, and the answer you get is informative regardless of what the data shows. Impression-level detail is what makes duplicate paths, frequency concentration, and publisher-level delivery patterns visible, none of which appear in aggregate reporting. A partner unable to supply it is telling you something about how much of the chain they can see, which is itself the thing you were trying to find out.
Is frequency waste counted in working media figures?
No, and it is probably the largest omission in the framework. An impression that was delivered, rendered, viewable, and human counts fully as working media even if it is the seventh exposure to the same household that evening. By any commercial definition that impression did nothing, and past a certain frequency it damages brand sentiment. Because CTV frequency management is genuinely difficult without shared identity, this waste is both common and entirely invisible in efficiency accounting.
Stay ahead of CTV and addressable TV
Get articles on streaming monetization, identity, and programmatic TV.
Subscribe + request demo →Head of CTV Product, LtvAdx
Related articles

CTV Geo-Targeting by IP: Whose Address Is It?
CTV country targeting rests on one IP lookup. It fails when the address is the SSAI server's, when IND meets IN, or when unknown counts as a match.

CTV Lift Tests: How Many Households You Need
A 10% lift on a 1% baseline needs 326,000 households split evenly, 906,000 with a 10% holdout, and about 2.5 million at 60% reach.

CTV Reach Curves: Why 70% Becomes 35%
The standard planning formula assumes perfect frequency control. Without it, a plan for 70% reach at frequency three delivers effective reach nearer 35%.

Whose Number Settles Your TV Guarantee?
A guarantee is a contract about a figure a third party produces later. With four certified currencies now in play, naming which one is the clause that matters.

CTV Ad Loudness: The Rule That Silences Spots
California's SB 576 extended loudness law to streaming on 1 July 2026. The failure mode is not a quieter ad. It is an ad that never runs at all.
Co-Viewing: The One CTV Number Nobody Audits
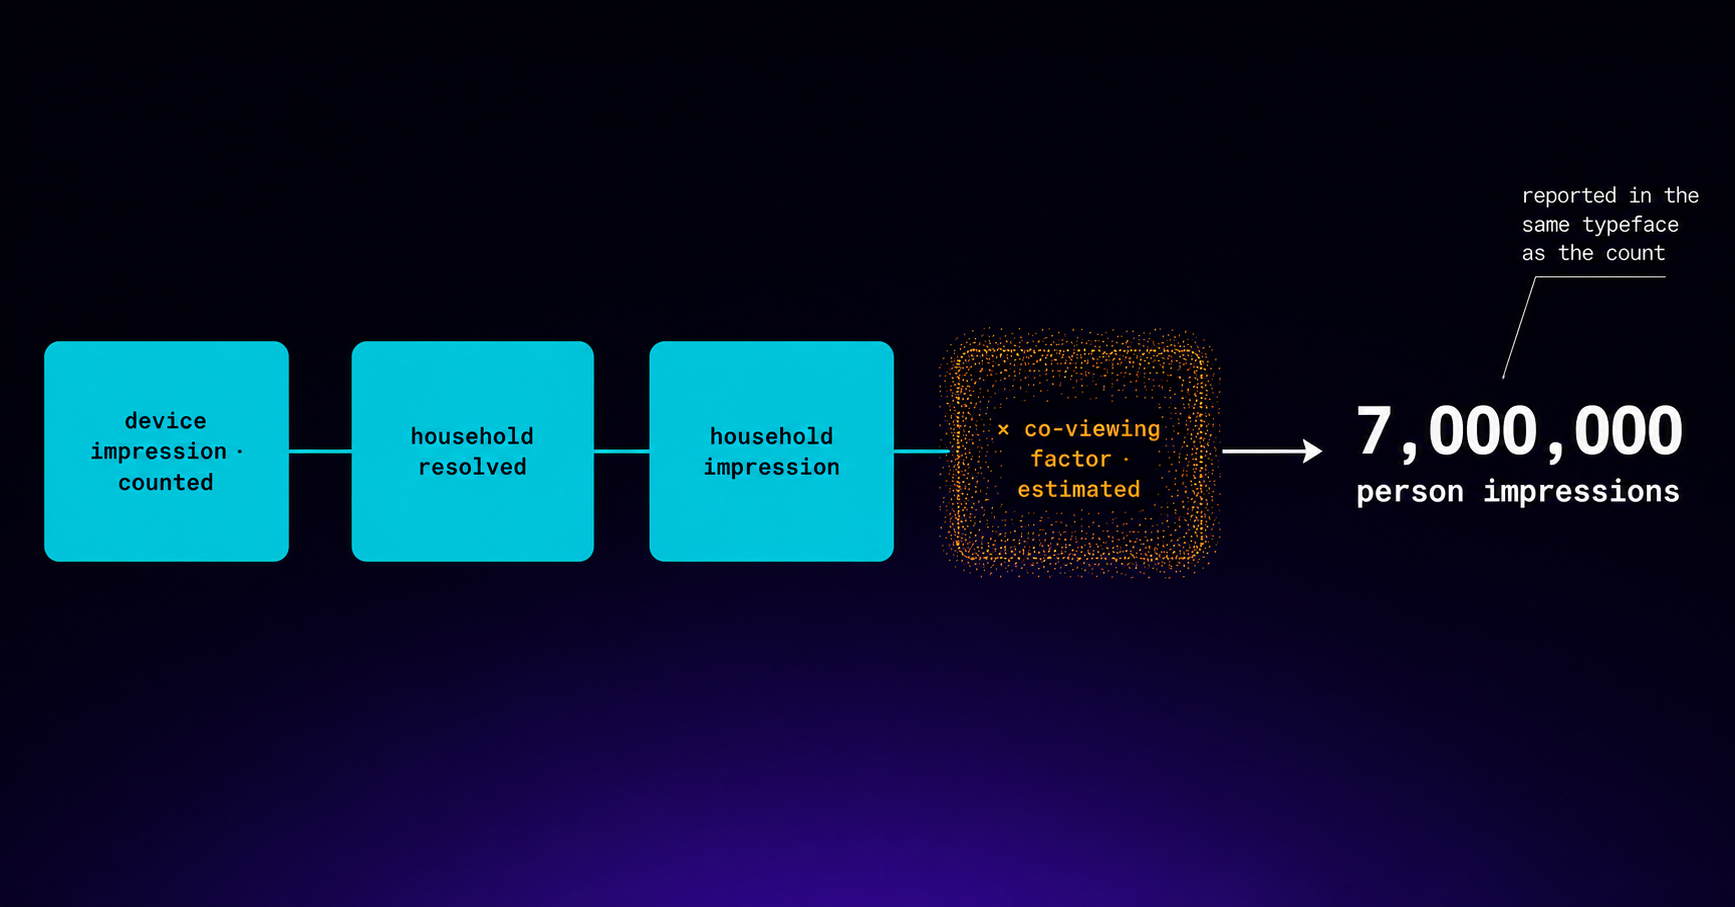
Every party in a CTV transaction benefits when the co-viewing multiplier is larger. Nobody has a reason to audit it, and the errors offset.
Start trading TV
Ready to monetise CTV inventory?
See how LtvAdx fits your streaming and addressable TV setup — start free or book a walkthrough.
<10ms
VAST decision latency
p99 under 15ms — product specification
7-tier
HouseholdID graph tiers
UID2 · PPID · ADID · DeviceID · ACR · IP/24 · fingerprint
Illustrative platform metrics · System status