CTV Lift Tests: How Many Households You Need
A 10% lift on a 1% baseline needs 326,000 households split evenly, 906,000 with a 10% holdout, and about 2.5 million at 60% reach.

To detect a 10% relative lift in a 1% baseline conversion rate, with 80% power at 5% significance, a CTV incrementality test needs about 163,000 households in each group. That is 326,000 in total if you split them evenly. With the more common 10% holdout, the total rises to about 906,000. If only 60% of the households in the test group are actually reached by the campaign, it rises again, to roughly 2.5 million.
That last number surprises people, because the rule of thumb in circulation is that holdout tests work from around 50,000 households. That figure is fine for large effects on high baseline rates. For the lifts most CTV campaigns realistically produce, it is too small by a factor of five or more, and a test that is too small does not return "no lift". It returns noise that looks like an answer.
This post works through the arithmetic: the four inputs that set sample size, the two multipliers most test plans ignore, a sample-size mistake I found in our own brand lift code, and the peeking problem that turns a 5% false-positive rate into roughly 20%.
What sets the number of households you need?
Four inputs, and you choose three of them.
- Baseline rate. The share of control-group households that convert anyway during the measurement window: a site visit, a signup, a purchase. You estimate this from history. Lower baselines need larger samples.
- Minimum detectable effect (MDE). The smallest lift you want the test to be able to see. Halving the MDE roughly quadruples the sample.
- Significance level. The false-positive rate you accept, conventionally 5%.
- Power. The probability of detecting the effect if it is really there, conventionally 80%. A test at 50% power is a coin toss on whether a real effect shows up.
For a two-group comparison of conversion rates, the standard approximation for households per group is:
n per group = (z_α/2 + z_β)² × [p₁(1−p₁) + p₂(1−p₂)] / (p₂ − p₁)²

p₁   = baseline conversion rate (control)
p₂   = p₁ × (1 + relative lift)
z_α/2 = 1.96   (5% significance, two-sided)
z_β   = 0.84   (80% power)

Example: p₁ = 1.0%, lift = 10%  →  p₂ = 1.1%
n = 7.85 × (0.0099 + 0.01088) / 0.000001  ≈  163,000 per group
The formula is nothing exotic. It is the same two-proportion calculation used for any A/B test. What makes CTV different is not the statistics but the inputs: low baseline rates, modest effects, and the fact that assigning a household to the test group does not mean it sees an ad.
Households needed, by baseline and lift
Here is the formula run across the range most CTV outcome tests fall into, at 80% power and 5% significance with an even split.
Baseline   Relative lift   Per group    Total (50/50)
────────   ─────────────   ─────────    ─────────────
0.5%       20%                 85,900         171,700
0.5%       10%                327,900         655,800
0.5%        5%              1,280,600       2,561,200
1.0%       20%                 42,700          85,400
1.0%       10%                163,100         326,200
1.0%        5%                637,000       1,274,000
2.0%       20%                 21,100          42,200
2.0%       10%                 80,700         161,400
2.0%        5%                315,200         630,400
The pattern is steady. Double the baseline and you roughly halve the sample. Halve the lift and you roughly quadruple it. The 50,000-household rule of thumb lands near the 20% lift rows, and a 20% relative lift is a strong result for most TV campaigns, not a planning assumption.
This is also why the choice of outcome matters as much as the choice of audience. A test measured on purchases at a 0.5% baseline needs four times the households of one measured on site visits at 2%. Where the business allows it, measuring an earlier, more frequent outcome and relating it to purchases separately is often the only way a test fits the budget. The CTV attribution and measurement guide covers the outcome options, and the performance advertiser's guide covers how buyers usually define them.
The holdout size multiplier
The table assumes an even split between test and control. Almost nobody runs CTV tests that way, because every household in the control group is a household the campaign deliberately does not reach. The common compromise is a 10% to 20% holdout.
An uneven split is less efficient. The variance of the comparison is dominated by the smaller group, so the total sample needed grows as the holdout shrinks:
Holdout share   Total households vs a 50/50 split
─────────────   ─────────────────────────────────
50%             1.00×
20%             1.56×
10%             2.78×
5%              5.26×

1.0% baseline, 10% lift:
  50/50 split    326,200 households
  90/10 split    906,100 households
The multiplier is 1 / (4 × h × (1 − h)), where h is the holdout share. A 10% holdout costs you 2.78 times the households of an even split to reach the same power. That can still be the right trade, because it keeps 90% of the audience in the campaign. It just needs to be priced in when the test is designed, not discovered when the result comes back inconclusive.
Reach dilution: the multiplier almost every test plan misses
The formula assumes every household in the test group was exposed. In CTV that is never true. Households are assigned to the test group before the campaign runs, and the campaign then reaches some fraction of them. The rest are in the test group on paper and unexposed in practice.
If you compare the whole test group against the whole control group, which is the clean, unbiased comparison known as intent-to-treat, the unexposed households dilute the measured effect. A campaign that lifts conversion by 10% among the households it reaches, and reaches 60% of the test group, shows a lift of about 6% across the whole group. Because required sample scales with the inverse square of the effect, the households needed scale by one over reach squared.
Reach of test group   Sample multiplier   Total (1% base, 10% lift, 90/10)
───────────────────   ─────────────────   ────────────────────────────────
100%                  1.00×                  906,100
 80%                  1.56×                1,415,700
 60%                  2.78×                2,516,800
 40%                  6.25×                5,662,900
Put a price on the 60% row. The test group is about 2.27 million households, of whom about 1.36 million are reached. At an average frequency of three and a $25 CPM, that is roughly 4.1 million impressions and about $102,000 of media for a test designed to detect a 10% lift. If the campaign budget is $40,000, the test cannot answer the question it was designed for, however carefully it is run.
Reach is the lever. A test run against a tighter audience that the campaign can actually saturate needs fewer households than one run against a broad audience it touches lightly. The reach curves post shows why reach flattens as spend rises, and the CTV budget calculator gives a first estimate of how much reach a given budget buys.
Three ways to build the control group
How you construct the control determines whether you can recover the power lost to dilution.
Intent-to-treat (no ad for the holdout). Holdout households are excluded from targeting. Simple, cheap and unbiased, and subject to the full reach dilution above. This is what most CTV holdout tests are.
Public service announcement (PSA) control. Holdout households are served a neutral ad from the same campaign setup. You can then compare households exposed to the real ad with households exposed to the PSA, which removes dilution. The cost is paying for the PSA impressions, which for a 10% holdout is about a ninth of the campaign's media again, and the PSA displaces whatever else would have run in that slot.
Ghost ads. For each holdout household, the ad server runs the decision as normal, records that the campaign would have won, and then serves whatever came next instead. You get a clean "would have been exposed" control group without paying for PSAs. It requires the decision engine to log counterfactual wins, which not every stack can do, and it only works where the campaign is bought through a platform that can run the decision for control households.
Whatever the method, assignment has to be deterministic at the household level, made before the campaign starts and enforced at decision time, so that a household cannot be in the control group on Monday and the test group on Tuesday. The usual approach is a stable hash:
// Deterministic household assignment for a 10% holdout
bucket  = sha256(householdId + ":" + studyId) mod 1000
control = bucket < 100        // 10%, stable for the study's life
Salting with the study ID matters. Without it the same households land in every study's control group, which both biases results and quietly excludes those households from all your advertising. The household identifier itself has to be stable across devices in the home, which is what a household ID is for. Our HouseholdID explainer and the identity product page cover how that identifier is built.
Survey brand lift, and the mistake I found in our own code
Brand lift studies swap conversions for survey answers: awareness, consideration, intent. The statistics are the same. The sample problem is worse, because only a small share of households answer a survey at all.
The LtvAdx brand lift service computes lift with a two-proportion z-test and reports a 95% confidence interval alongside the point estimate. While preparing this post I reread the design note at the top of that service. It said a minimum of 200 completed surveys per group gives a minimum detectable effect of 5 percentage points for awareness.
It does not. At a 30% baseline awareness, 80% power and 5% significance:
Completes per group   Minimum detectable effect
───────────────────   ─────────────────────────
  200                 13.4 percentage points
  500                  8.4 percentage points
1,000                  5.9 percentage points
1,374                  5.0 percentage points

Power to detect a 5-point lift with 200 per group:  about 19%
With 200 completes per group, a real 5-point awareness lift would be detected about one time in five. The note was wrong by a factor of about seven on the sample needed. The calculation code was correct; the planning guidance written above it was not, and planning guidance is what people actually read. The note has been corrected. The general lesson is that confidence intervals computed after the fact do not rescue an underpowered design. They just report, accurately, that the answer is somewhere in a very wide range.
Survey response rates make this harder. Completes, not exposures, are what count. If 2% of surveyed households respond, an assumption to replace with your own vendor's figure, then 1,374 completes needs about 68,700 surveyed households per group. Planning a brand lift study starts from the completes you need and works backwards to the audience you must reach.
Peeking turns 5% into 20%
A test designed for a 5% false-positive rate only has that rate if you look at the result once, at the end. Checking the dashboard daily and stopping the first time it shows significance inflates the false-positive rate, because each look is another chance for random variation to cross the line.
I simulated tests where no real effect exists and the result is checked at evenly spaced intervals, stopping at the first significant reading:
Looks during the test   Actual false-positive rate
─────────────────────   ──────────────────────────
 1                      5%
 5                      14%
10                      20%
20                      25%
Ten looks, and one test in five reports a lift that does not exist. Those are the tests that get written up as wins, and their results do not replicate in the next flight.
Two honest fixes. Fix the duration and the sample in advance and look once. Or, if the business genuinely needs interim reads, use a sequential design that spends the 5% across planned looks, with stricter thresholds early and a near-normal threshold at the end. Either is fine. Watching a standard test daily is not.
When you cannot randomise households: geo tests
Some campaigns cannot hold out individual households: linear TV buys, platforms without a stable household identifier, or advertisers whose outcome data only exists at market level. The alternative is to randomise geographies. Some markets get the campaign, matched markets do not, and the outcome is compared across them.
The unit of analysis is then the market, not the household, and power comes from the number of markets. There are 210 Nielsen DMAs in the United States, and a test that uses a few dozen of them has far fewer independent units than a household test, however many households those markets contain. Geo tests also need markets matched on pre-period trends, a longer pre-period to establish those trends, and care over spillover when media or commuters cross market boundaries. The CTV geotargeting guide covers the targeting side, and addressable linear TV covers where household-level holdouts become possible on linear.
How long should the test run?
Long enough for two things to happen: for the campaign to build frequency in the test group, and for the conversions it causes to occur.
The first depends on flight pacing. A household that has seen the ad once is not the household the campaign is designed to affect, and a test that ends before frequency builds measures the first exposure rather than the campaign. The second depends on the purchase cycle. A subscription service may see responses within days; a car purchase may lag by weeks. The measurement window should cover the flight plus the expected lag, and should be fixed before the test starts.
Duration is also a sample-size lever, since a longer window raises the baseline conversion rate. Extending a window from two weeks to four roughly doubles a steady baseline, which roughly halves the households needed. That is often the cheapest way to make an underpowered test viable.
What a clean result actually measures
A well-designed holdout test measures the incremental effect of this campaign, on this supply, over this window, against a control group that still watched everything else. Holdout households still see linear TV, other streaming services and your other channels. The test does not measure whether TV works. It measures what this buy added.
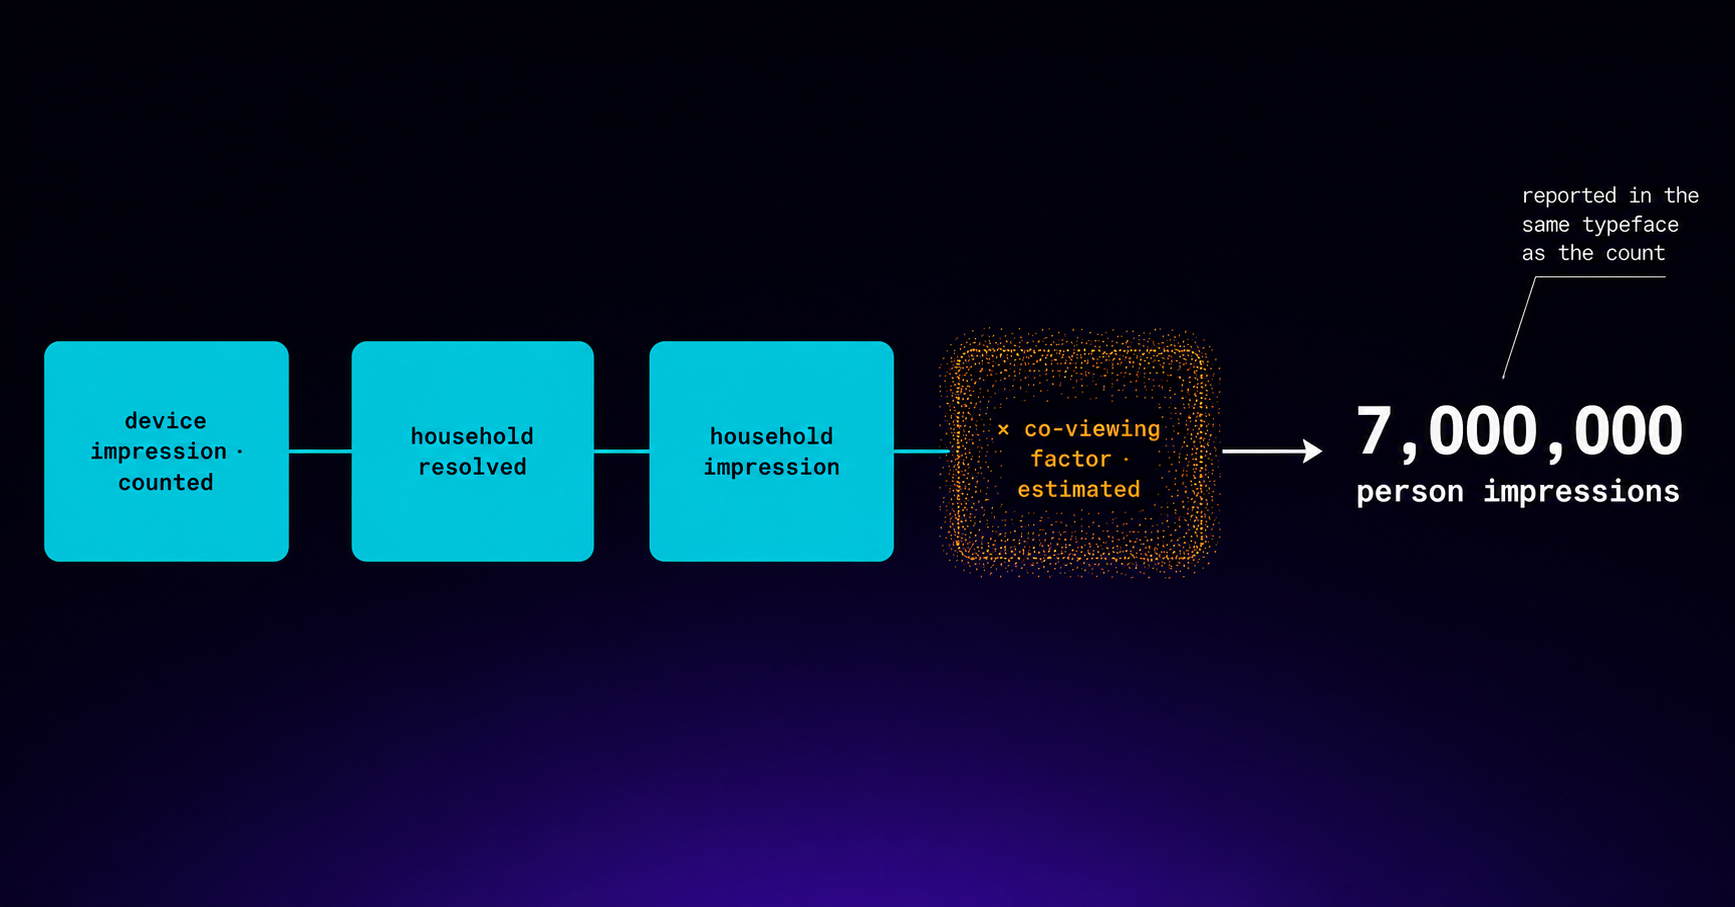
It also measures households, not people. A household-level lift includes co-viewing, which varies by daypart and content, and it is worth being explicit about that when the result is compared with person-level channels. The co-viewing post covers that gap. When a lift result feeds into a guarantee or a make-good discussion, the measurement source question from whose number settles a TV guarantee applies here too.
Turning the lift into a number a planner can use
A lift percentage is not a planning input. Cost per incremental conversion is. Converting one into the other is where incrementality testing earns its cost, because the answer is usually very different from what the attribution dashboard reported for the same campaign.
Take the 60% reach scenario above and suppose the test succeeds: a true 10% lift on a 1% baseline among the 1.36 million households reached, bought for about $102,000.
Households reached                1,359,100
Conversions among them (1.1%)        14,950   ← what exposure-based attribution counts
Conversions caused by the ads         1,359   ← the 0.1-point lift only

Media cost                         $101,900
Cost per attributed conversion        $6.82
Cost per incremental conversion      $75.00   (11× higher)
Both numbers describe the same campaign. The attributed figure credits the ad with every reached household that converted, including the roughly 13,600 that would have converted anyway. The incremental figure credits it only with the difference the holdout reveals. The factor between them is set by the baseline: at a 1% baseline and a 10% lift, eleven attributed conversions exist for every caused one.
That gap is widest for audiences that were likely to convert regardless. Retargeting pools and existing-customer segments have high baselines, so they look outstanding on attributed cost and often much less so on incremental cost; the CTV retargeting guide is worth reading with this in mind. Direct-to-consumer brands, who tend to judge CTV against paid social on cost per acquisition, benefit most from making the comparison on incremental numbers, as the CTV for DTC brands post argues. The incremental cost is the figure to carry into the next campaign plan, and the one to put in front of whoever approves the budget through the advertiser platform.
A worksheet to fill in before the test
Outcome metric and definition        ____________________
Measurement window (flight + lag)    ____ days
Baseline rate in that window         ____ %   (source: ______)
Minimum detectable relative lift     ____ %
Significance / power                 5% / 80%
Holdout share                        ____ %   → multiplier ____
Expected reach of test group         ____ %   → multiplier ____
Control method                       ITT / PSA / ghost ads
Households required                  ____
Media required to reach them         $____
Number of looks before the end       1  (or sequential plan: ____)
If the households required exceed the audience available, or the media exceeds the budget, change the design before launch: a more frequent outcome, a longer window, a larger holdout, a tighter audience, or a larger MDE honestly stated. Launching anyway produces a result nobody should act on. Agencies planning these for several clients at once will find the agency tools useful for keeping audiences and flights separate, and the reporting for reading the delivery side of the test.
Frequently asked questions
How many households do I need for a CTV incrementality test?
It depends on the baseline conversion rate and the lift you want to detect. At a 1% baseline and a 10% relative lift, with 80% power and 5% significance, you need about 163,000 households per group, or 326,000 with an even split. A 10% holdout raises the total to about 906,000, and if the campaign reaches only 60% of the test group the requirement rises to roughly 2.5 million.
Is 50,000 households enough for a holdout test?
Only for large effects on relatively high baseline rates. At a 1% baseline, about 85,000 households split evenly are needed to detect a 20% relative lift, and 20% is a strong result for most TV campaigns. For a 10% lift the requirement is several times larger. An underpowered test does not reliably return no lift; it returns a noisy estimate that is easy to misread.
What size should a CTV holdout group be?
Common practice is 10% to 20%, trading measurement power against the audience the campaign gives up. A smaller holdout needs more total households: a 10% holdout requires about 2.78 times the households of an even split for the same power, and a 5% holdout about 5.3 times. Decide the holdout share at design time and size the test accordingly.
Why does reach matter for incrementality test size?
Because households assigned to the test group but never reached dilute the measured effect. If the campaign reaches 60% of the test group, a true 10% lift among reached households appears as about 6% across the group. Required sample scales with one over reach squared, so 60% reach multiplies the households needed by about 2.8.
How many survey responses does a brand lift study need?
To detect a 5-point lift from a 30% baseline at 80% power, about 1,374 completed surveys per group. With 200 per group the minimum detectable lift is about 13 points, and a real 5-point lift would be detected only about one time in five. Work backwards from completes to surveyed households using your vendor's response rate.
Can I check incrementality results during the test?
Only with a design built for it. Checking a standard test repeatedly and stopping at the first significant result inflates false positives: in simulation, ten evenly spaced looks produced a false-positive rate of about 20% instead of 5%. Either fix the duration and look once, or use a sequential design that plans the interim looks and adjusts the thresholds.
What is the difference between ghost ads and a PSA control?
Both let you compare exposed households with comparable control households rather than the whole group. A PSA control serves the holdout a neutral ad and pays for those impressions. Ghost ads run the ad decision for holdout households, log that the campaign would have won, and serve something else, avoiding the PSA cost. Ghost ads require a decision engine that can log counterfactual wins.
Stay ahead of CTV and addressable TV
Get articles on streaming monetization, identity, and programmatic TV.
Subscribe + request demo →Head of CTV Product, LtvAdx
Related articles

CTV Reach Curves: Why 70% Becomes 35%
The standard planning formula assumes perfect frequency control. Without it, a plan for 70% reach at frequency three delivers effective reach nearer 35%.

Whose Number Settles Your TV Guarantee?
A guarantee is a contract about a figure a third party produces later. With four certified currencies now in play, naming which one is the clause that matters.

CTV Ad Loudness: The Rule That Silences Spots
California's SB 576 extended loudness law to streaming on 1 July 2026. The failure mode is not a quieter ad. It is an ad that never runs at all.

Where Your CTV Ad Dollar Actually Goes
The ANA traced it: 36 cents of every programmatic dollar reached working media in 2023, about 45% by 2026. CTV is the fastest-growing and least efficient slice.
Co-Viewing: The One CTV Number Nobody Audits
Every party in a CTV transaction benefits when the co-viewing multiplier is larger. Nobody has a reason to audit it, and the errors offset.
Your CTV Media Plan Is Set by Approval Queues
Twelve publishers, twelve spec documents, eleven days. Budget flows to whoever cleared first, and that has nothing to do with audience fit.
Start trading TV
Ready to monetise CTV inventory?
See how LtvAdx fits your streaming and addressable TV setup — start free or book a walkthrough.
<10ms
VAST decision latency
p99 under 15ms — product specification
7-tier
HouseholdID graph tiers
UID2 · PPID · ADID · DeviceID · ACR · IP/24 · fingerprint
Illustrative platform metrics · System status