CTV Ad Avails: How to Measure Your Real Inventory
Ad requests are not avails. How to filter, split and report a channel's real CTV inventory, count unique households and turn it into a forecast.
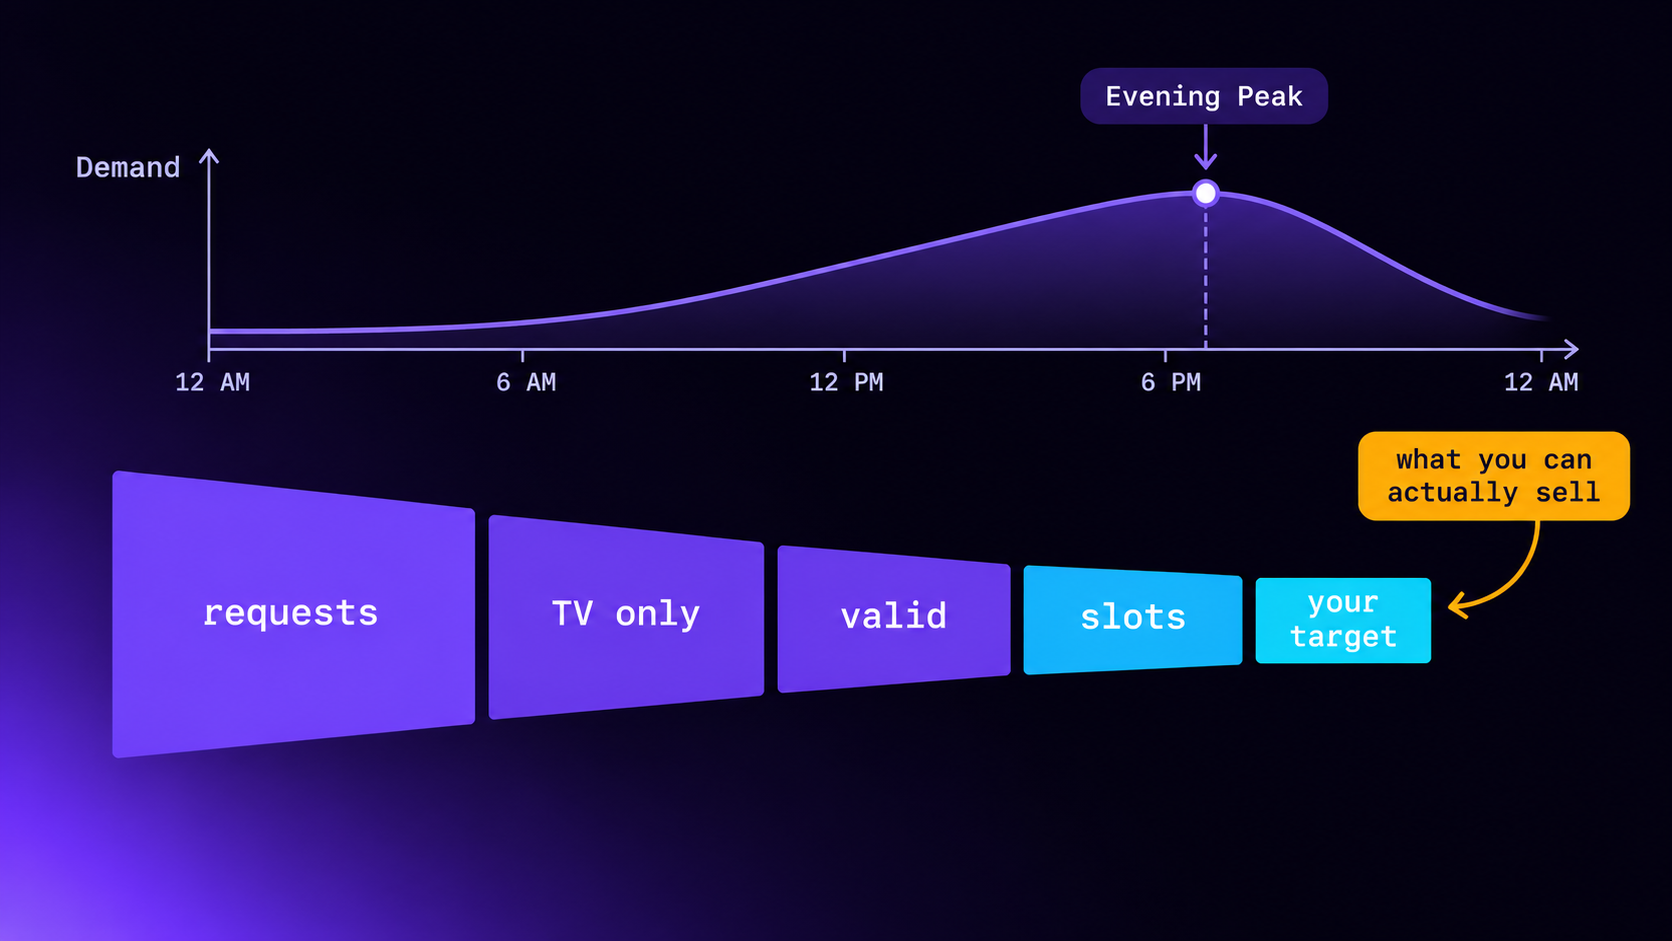
CTV ad avails are the ad slots a channel can actually offer: the number of real viewers on real televisions, multiplied by the ad time they sit through. To measure them honestly, start from ad requests but do not stop there. Keep only requests from TV devices, remove invalid traffic, count ad slots rather than requests, and report impressions that played alongside how much of the audience you can actually identify. Then split the result by platform, country and hour, because buyers purchase those cuts rather than a single total. Most inflated inventory numbers come from one mistake: treating ad requests as avails. A channel can report ten million monthly requests and still have far less sellable inventory than that number implies.
This post explains how to calculate avails from viewing hours, how to measure them from your ad server, which numbers buyers trust, and what we changed in LtvAdx to make the figures on a channel's card something both sides can rely on.
What an avail is, and what it is not
An avail is one opportunity to show one ad. It sounds simple, and it hides four numbers that people swap freely.
Term             What it counts                               Who cares
───────────────  ───────────────────────────────────────────  ──────────────────
Ad break         A pause in the programme for ads             Programming
Ad request       One call to the ad server                    Your ad ops
Ad slot / avail  One position in a break that an ad can fill  Sellers, planners
Impression       An ad that started playing                   Buyers, billing
Complete         An ad that played to the end                 Buyers, reporting
The confusion comes from the ratios between them. One request can return an entire ad pod, so a two-minute break with four 30-second slots may be one request and four avails. Or a player may retry, so one slot may be two requests. And a request can return ads that never play. Multiplying or dividing without knowing which case you are in gives numbers that are confidently wrong.
The relationship between what is returned and what plays is the subject of our post on fill rate versus rendered impressions. This post starts one step earlier: how much inventory exists in the first place.
How to estimate avails from viewing
If your channel is new or you are planning one, you can estimate avails with arithmetic before you have a single ad request.
viewer-hours per month
  × ad minutes per viewing hour
  × 60 ÷ average ad length in seconds
  = ad slots per month, if every break plays in full

Example (illustrative)
  Average audience across the day    1,000 viewers
  Hours per month                    720
  Viewer-hours                       720,000
  Ad minutes per hour                8
  Average ad length                  30 s  → 2 slots per ad minute
  Avails = 720,000 × 8 × 2           = 11,520,000 ad slots a month
That is a ceiling, not a forecast. Now apply what really happens. Not every viewer stays through a break. Not every platform can be sold. Not every country has demand. And a viewer who is known to have seen a campaign three times is no longer an avail for that campaign. In practice, the sellable number for any particular buyer is far smaller than the ceiling, which is why planning from the ceiling leads to promises a channel cannot keep.
Ad load is the other lever. Eight minutes an hour is a common figure, not a rule, and pushing it up increases avails on paper while reducing viewing time. The post on ad fatigue and viewer experience covers that trade-off, and the FAST yield optimisation guide covers how ad load affects revenue over a month rather than over a break.
How to measure avails from your ad server
Once a channel is live, stop estimating and start measuring. The ad server sees every request, filled or not, which makes it the best source of inventory data you have, as long as you clean it up in the right order.
Step 1: count only TV devices
Ad tags leak. A channel's VAST tag ends up in a web player, a test harness, a QA tool, or a scraper. In LtvAdx, the inventory measures count only requests whose user agent is a television or streaming device. That matches the "TV requests" class in our serving ledger, so the inventory figure and the operations figure cannot disagree. If your report has no device filter, assume the top-line figure is inflated.
Step 2: remove invalid traffic
Requests from data centres, known bots and spoofed apps are not inventory. Report invalid traffic as a percentage of served impressions so a buyer can see it, and subtract it from anything you call valid. The CTV ad fraud post covers what to look for, including fake server-side stitching.
Step 3: convert requests to slots
Use what you know about each break. With pods, one request can carry several slots. Record the requested pod duration or slot count, so a request becomes the number of ads it could have held. Without that, a channel that changes pod length looks as though its inventory moved.
Step 4: report what played
Valid impressions and completes are what buyers pay for. Show them next to requests, and let the gap speak. A channel whose requests are high and impressions low has a demand, floor or delivery problem, not an inventory one.
Step 5: split by what buyers buy
A total is almost useless to a planner. They need to know how much of it is on the platforms, in the countries and at the hours they want. The next sections cover the three splits that matter most.
Platform split: the first question every planner asks
A buyer with a Roku-only creative, or a campaign that excludes a particular device, needs the split straight away. It also tells you a lot about your own business. A channel with most of its audience on one platform depends on one distribution deal. The cost of losing it is more than the ad revenue.
We show the platform split for a 28-day window. Shorter windows swing with programming, and longer ones hide a recent launch on a new device.
Country: known, unknown and claimed
Country is where inventory reports get dishonest without anyone intending it. A country figure can come from three places: the viewer's real IP address, a value sent by a stitcher in the request, or what the publisher declared for the channel. Only the first is a measurement.
So LtvAdx counts a country only when it was measured from the viewer's own connection. A country supplied by a proxy, or one declared in a setting, says nothing measured about that viewer, and it is counted as unknown. The share of unknown traffic is itself shown, so a buyer can see how much of the split rests on evidence. We learned why this matters in October, when we found that any client could set its own country with a header. The IP geotargeting post covers how accurate country data is in CTV.
Measuring country on every request, filled or not, matters too. Most systems only know the country of served impressions, so a channel with no demand in Germany looks as though it has no German audience. Unfilled German requests are precisely what a German advertiser wants to know about. Our meter counts requests per day, per channel, per country, regardless of whether an ad was served.
The hour curve and the break mix
FAST audiences move through the day, and a flat average hides that. A channel with a strong evening and a weak morning cannot deliver a campaign evenly across 24 hours, however large its daily total. Publishing the hour curve lets a planner choose pacing that suits it.
The break mix matters for the same reason. Pre-roll, mid-roll and live breaks behave differently, so a buyer who wants mid-roll only needs that figure, not the blend. The ad pod strategy post covers how break position affects completion and value, and the ad pod fill simulator lets you model a structure.
Unique households: why you cannot add them up
Reach is the number buyers care about most, and the one most often reported wrongly. If 10,000 households watch on Monday and 10,000 on Tuesday, the two-day total is not 20,000. Many of them are the same households. Daily uniques cannot be summed into weekly or monthly uniques.
The correct way is to keep every household ID seen in a period and count the distinct ones, which is expensive to do for every channel. The practical answer is a HyperLogLog, a data structure that estimates distinct counts in a small, fixed amount of memory. Redis's implementation uses at most 12 KB and has a standard error of 0.81%. LtvAdx keeps one for each channel and day. Daily sketches can be merged, so a 28-day figure is a true distinct count across the period, not a sum.
Three details keep this figure honest.
Only identified, consented households count. Anonymous session IDs are excluded, because counting them would turn "sessions" into "households". A channel whose viewers mostly send no household ID will show a low unique count and a low known-household share, and that is the truth about how addressable it is.
It is shown as a band, not a precise number. Buyers see a range, because a sketch is an estimate and false precision helps nobody. A household count that claims four significant figures is claiming more than the data supports.
Under load, it may read a little low, by design. The meter never makes an ad request wait. Household IDs go into a bounded queue, and if that queue is full, they are dropped. The estimate may be slightly low during a spike, but ad serving is never slowed down to improve a statistic.
The post on CTV reach curves explains what to do with reach once you have it, and the post on household IDs covers where those IDs come from.
Addressable avails are a smaller number
A buyer who wants household targeting, frequency capping across channels or attribution is not buying your total. They are buying the part of it where a viewer can be identified, with permission. That number is often much smaller, and a channel should know it.
Three things reduce it. Some devices send no usable identifier. Some viewers have opted out or limited ad tracking. And some viewers have not given consent where consent is required.
In LtvAdx a request without consent still counts as inventory, because the ad slot exists and can carry a contextual ad. But the viewer is not identified, and that request cannot be sold as a household-targeted impression. Since late October the ad server enforces this: no consent means contextual ads only, with the viewer not identified to outside demand platforms.
So a channel card has two shares worth reading together: consent share and known-household share. A channel with a large audience and a low known-household share should sell on content, daypart and platform. It may do very well. It should not promise household-level reach. The post on CTV identity without cookies covers what identifiers are available, and the post on addressable linear TV covers how addressable inventory is sold.
Declared versus measured: keep them apart
Every channel has facts only its owner knows: the kind of content, the languages, the audience it believes it reaches, the ad break policy. Those matter to a buyer, and they are not measurements. We keep them apart everywhere, and label them.
In LtvAdx, a publisher's Inventory page holds a declared profile, and each buyer-facing card marks it as "Reported by publisher". Measured figures sit beside it and come from the delivery data, recalculated every hour. A publisher sees exactly the card a buyer sees. Revenue, floors and share never appear on it.
Demographics get the strictest treatment. Self-reported demographics that are presented as measured are the most common way channels mislead buyers, usually by accident. Ours are labelled by source, never blended into one figure, and hidden below a minimum sample. A demographic figure needs at least 1,000 known households behind it, and any single cell needs at least 100, so a small local channel's audience cannot be broken down into groups small enough to identify people. The post on CTV audience segments covers how these are used for targeting.
Small samples: say nothing rather than something wrong
A new channel with 40 impressions and 38 completes has a 95% completion rate. Nobody should believe it.
So rates and shares on our channel cards are hidden below 100 observations. A completion rate needs 100 valid impressions behind it, an invalid traffic rate 100 served impressions, a country split 100 requests with a known country. Until then, the card shows nothing rather than a confident percentage. Buyers learn more from a blank than from a number that will move by twenty points next week.
Windows help too. We calculate figures over 7, 28 and 90 days, and show how many active days each is based on, so a channel that launched last week cannot look like a mature one. A "Serving" badge means an ad was actually served in the last 14 days, not merely that the channel exists.
Requests are shown as a band as well. Exact request counts invite exactly the wrong comparison. Buyers should compare valid impressions, not requests, and bands discourage ranking channels on the number most easily inflated.
Six ways inventory gets inflated by accident
None of these needs bad intent. Each is a shortcut that looks reasonable until a buyer compares it with delivery.
- Reporting requests as impressions. The largest and most common.
- Counting player retries. A player that times out and asks again produces two requests for one slot.
- Counting pre-fetch. Some apps request ads before a break and discard them if the viewer leaves, so a request may never have been near a screen.
- Adding channels together. One household watching three channels is three on a sum of channel reports and one in reality.
- Counting test and QA traffic. A soak test left running on a staging build can look like a very loyal audience.
- Quoting the best month. A big live event lifts a month sharply. Use a run rate that excludes it, or state it separately.
A simple sanity check catches most of them: compare your stated monthly avails with your viewing hours. If the avails imply far more ad minutes per hour than your channel runs, the number is counting something other than ad slots.
A worked example
An illustration, not any real channel's data. Here is how one channel's month might look as each step is applied.
Step                                                Monthly figure
──────────────────────────────────────────────────  ──────────────
Raw ad requests in the log                               6,000,000
TV device requests only                                  4,200,000
After removing invalid traffic (3%)                      4,074,000
Slots, at an average of 2.5 ads per request             10,185,000
Slots in the US on Roku, the buyer's actual target       1,950,000
At $12 CPM, if every slot sold                             $23,400
The salesperson who quotes six million requests and the planner who needs under two million slots on one platform in one country are talking about the same channel. The last two lines are the ones to agree before anyone signs anything. The CPM calculator and the budget calculator help with that conversation, and the CTV pricing guide covers typical rates.
Turning avails into a forecast
Avails describe the past. A sold campaign needs a forecast.
- Start from a 28-day run rate, by hour and day of the week. A 90-day window smooths seasonality but hides recent changes; use it as a sanity check.
- Apply the campaign's targeting. Platform, country and channel, using the splits above.
- Subtract what is already sold. Direct campaigns take priority, so their impressions are not available to anyone else.
- Allow for frequency. A cap of three per household per week limits delivery on a small audience far more than the avail count suggests. Unique households are the check here.
- Guarantee less than you forecast. A guarantee at about 80% of the forecast leaves room for a quiet week. Making up a shortfall costs more than the extra sale earned.
The post on selling ads directly on a FAST channel covers how a guaranteed campaign is paced against this, and the programmatic guaranteed guide covers selling a guarantee programmatically.
What a buyer should ask
- Are these requests, slots, impressions or completes?
- Is traffic filtered to TV devices, and what is the invalid traffic rate?
- How much is on my platform, in my country, at my hours?
- How is the country measured, and what share is unknown?
- Are unique households deduplicated across the period, or summed?
- What share of the audience has a known household?
- Which figures are measured, and which are declared by the publisher?
- Is the channel authorised through app-ads.txt? The supply path optimisation guide explains why that comes first.
The short version
Inventory is not a number a channel states. It is a set of filtered, split measurements that a buyer can check. Requests are the raw material. Valid impressions on the right platform, in the right country, at the right hour, are what can be sold. Publishers who report it that way sell less on paper and deliver more in practice, and they are the ones whose renewals come in.
The publisher page shows how LtvAdx presents channel inventory, operators of FAST channels can see the wider picture on the FAST channels page, and the guide to FAST channel monetisation covers what to do with it. You can create a publisher account and see your own card.
Frequently asked questions
What are ad avails in CTV?
Ad avails are the ad slots a channel can offer: one avail is one opportunity to show one ad. They are different from ad requests, because one request can carry several slots in a pod, and from impressions, which are the ads that actually started playing.
How do you calculate CTV ad inventory?
Multiply viewer-hours by ad minutes per hour, then by the number of ads per minute. For example, 720,000 viewer-hours at 8 ad minutes per hour and two 30-second ads per minute is 11.52 million slots a month. Treat that as a ceiling, then reduce it for targeting, invalid traffic and viewers who leave.
What is the difference between ad requests and impressions?
An ad request is a call to the ad server. An impression is an ad that started playing. Requests can be retried, filled with several ads or returned empty, and returned ads may not play, so the two can differ widely. Buyers pay for impressions.
How do you count unique households on a CTV channel?
Use distinct counting across the whole period, not a sum of daily figures, because the same households return. A HyperLogLog sketch per day can be merged into a distinct estimate over any window. Count only identified households, and report the result as a range.
What should a FAST channel report to advertisers?
Valid impressions, completion rate, invalid traffic rate, platform and country splits, an hour curve, the break mix and the share of audience with a known household. Label declared facts as declared, and keep them apart from measured ones.
Why does my CTV inventory look lower than my ad requests?
Because requests include web players, test traffic, bots and retries. After filtering to TV devices and removing invalid traffic, the remaining figure is smaller, and it is the one a buyer will trust. Slots can then exceed requests when requests carry pods.
How much CTV inventory can I guarantee to an advertiser?
Forecast from a recent 28-day run rate, apply the campaign's targeting, subtract what is already sold, allow for frequency caps, and guarantee less than you forecast. Around 80% of the forecast leaves room for a quiet week without a make-good.
Stay ahead of CTV and addressable TV
Get articles on streaming monetization, identity, and programmatic TV.
Subscribe + request demo →Head of CTV Product, LtvAdx
Related articles
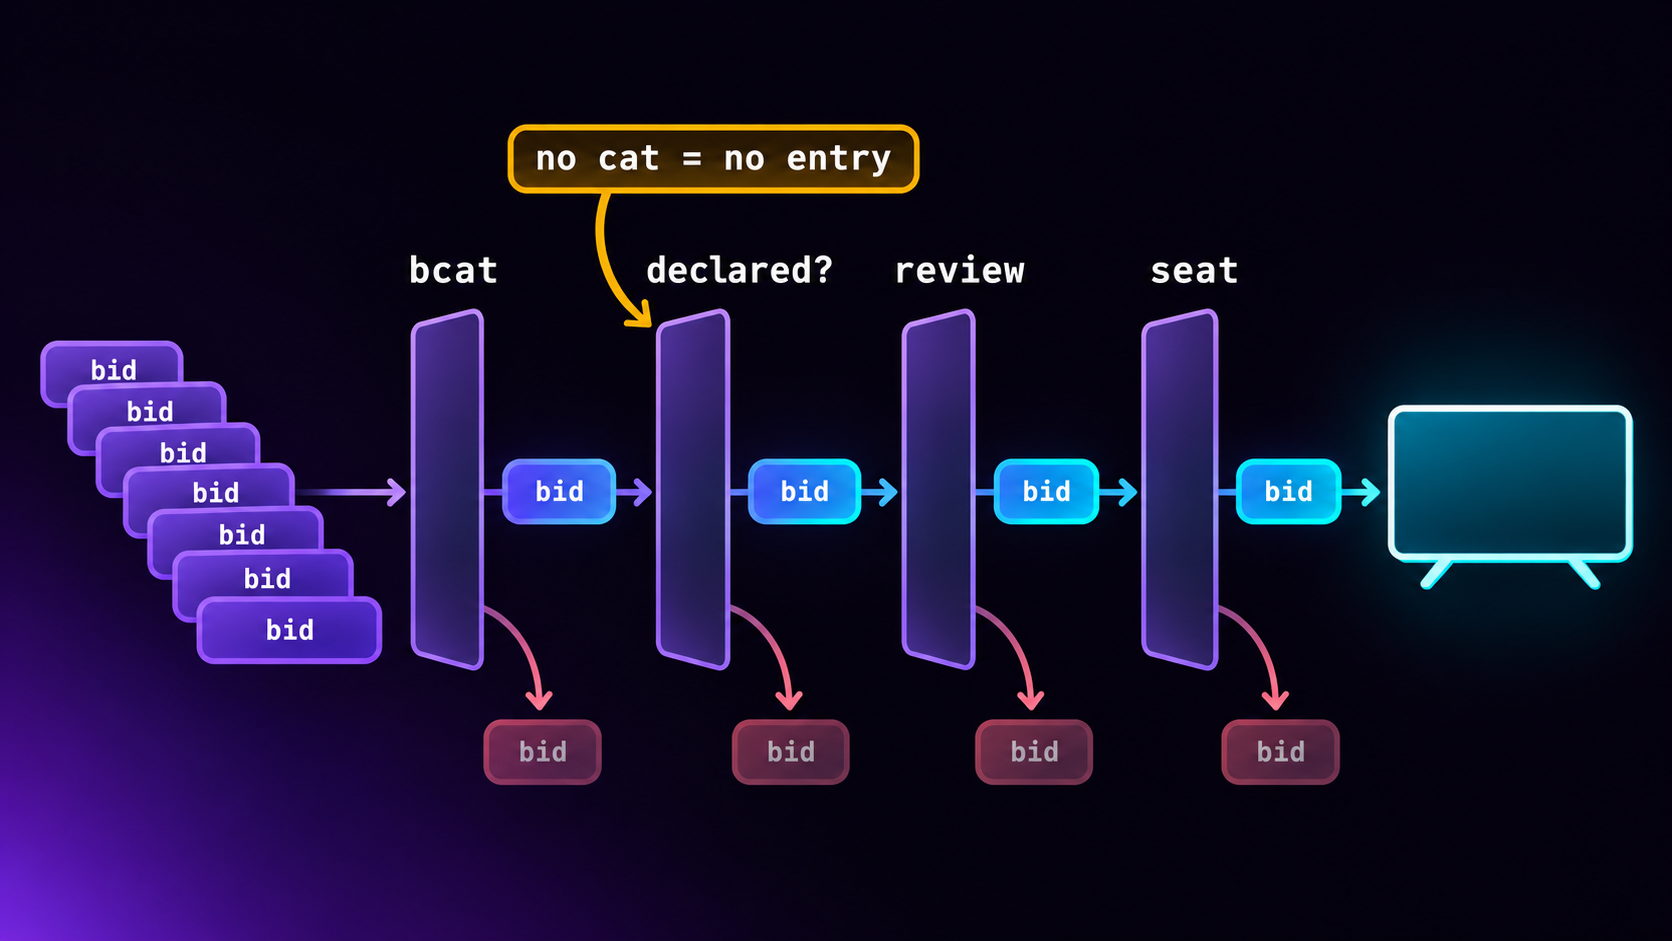
CTV Ad Category Blocking: What bcat Really Blocks
OpenRTB defaults to a deprecated taxonomy with no gambling or crypto codes. How bcat, badv and cattax work, where CTV block lists leak, and how to close them.
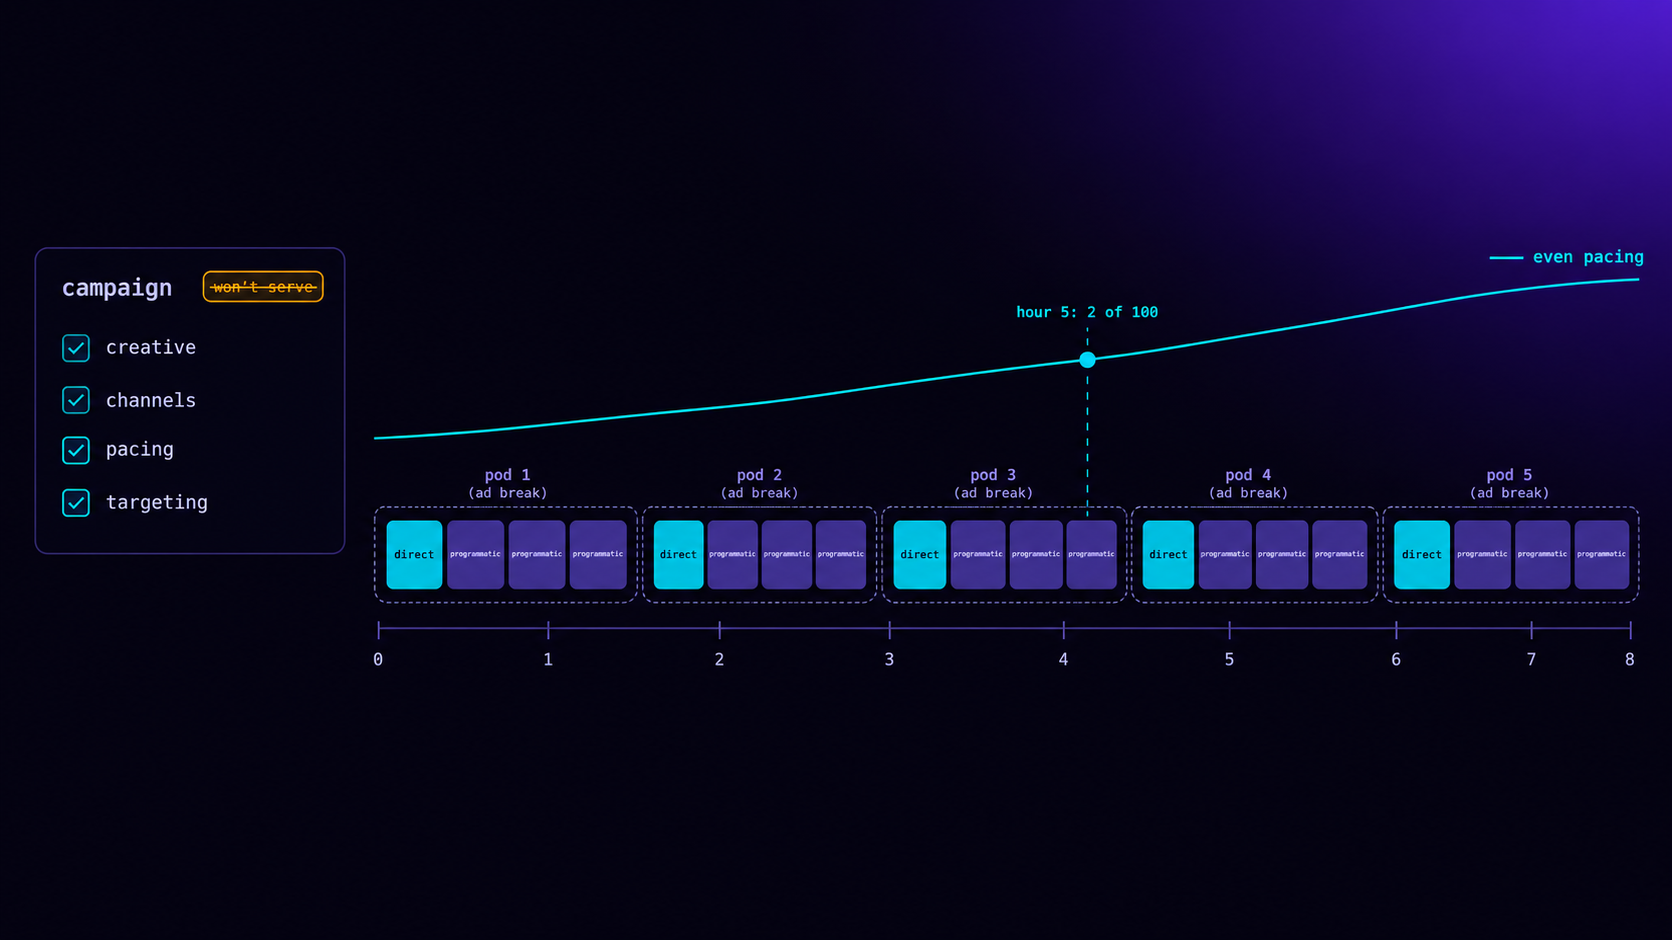
Selling Ads Directly on Your FAST Channel
What a direct-sold CTV campaign needs to serve: a playable creative, channels, pacing and targeting. Plus the defects we fixed and a live test.
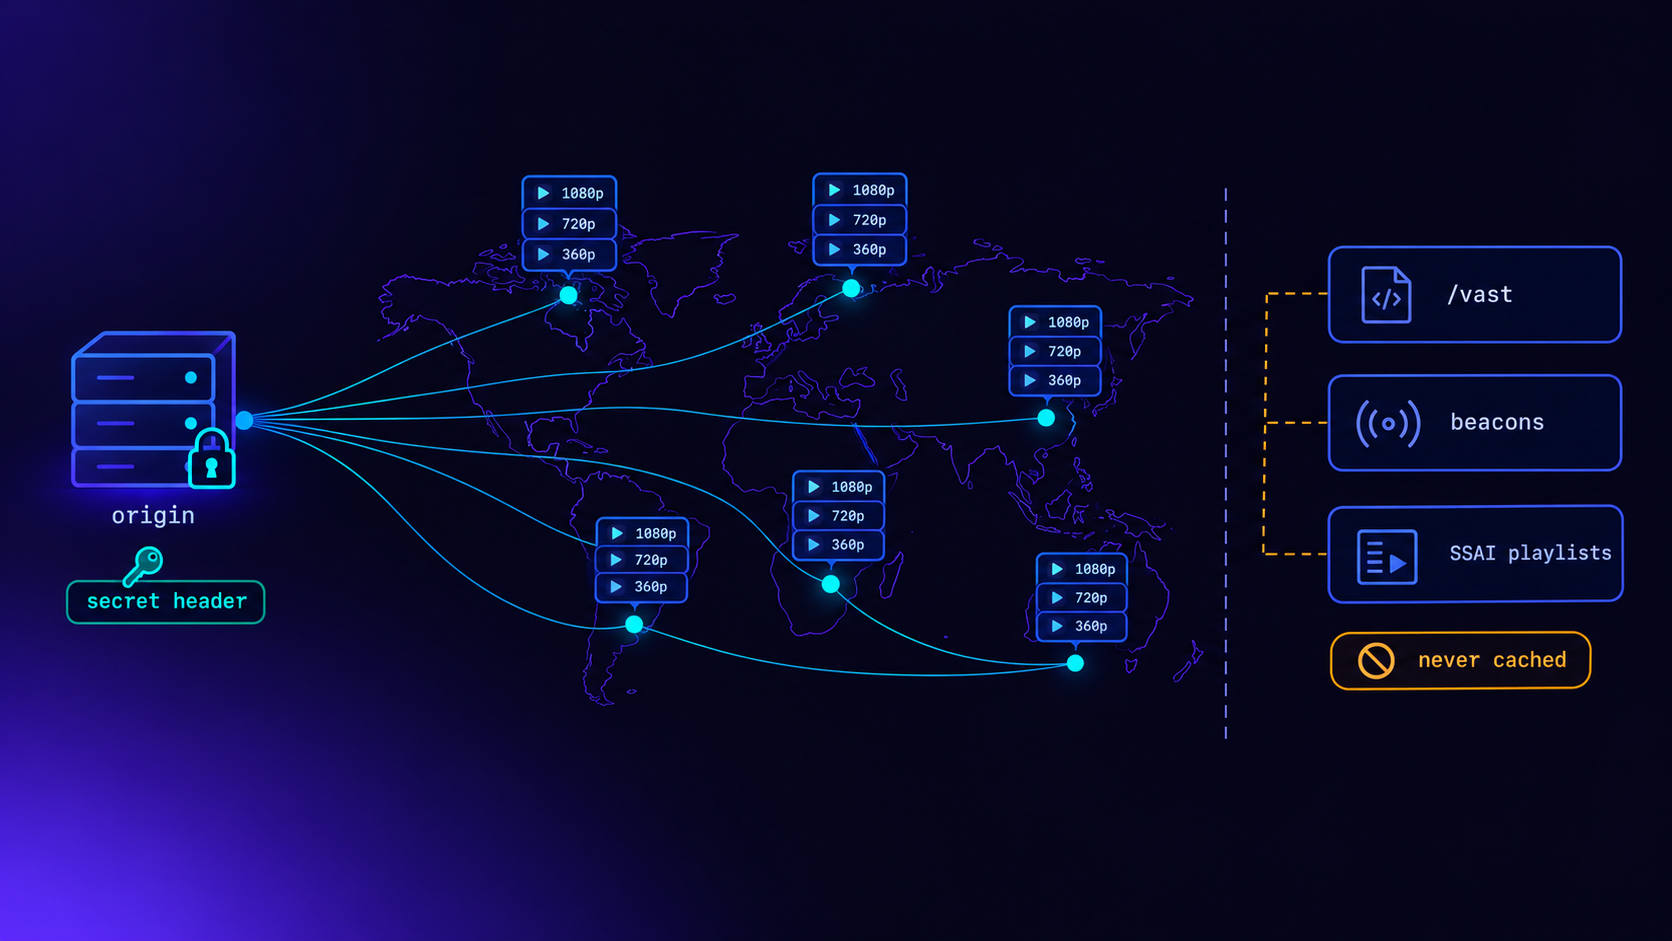
CDN for CTV Ads: What to Cache, What to Keep Off
Put CTV ad media on a CDN, keep VAST, beacons and SSAI manifests off it. The caching rules, two near-outages and a DNS mistake from our own cutover.
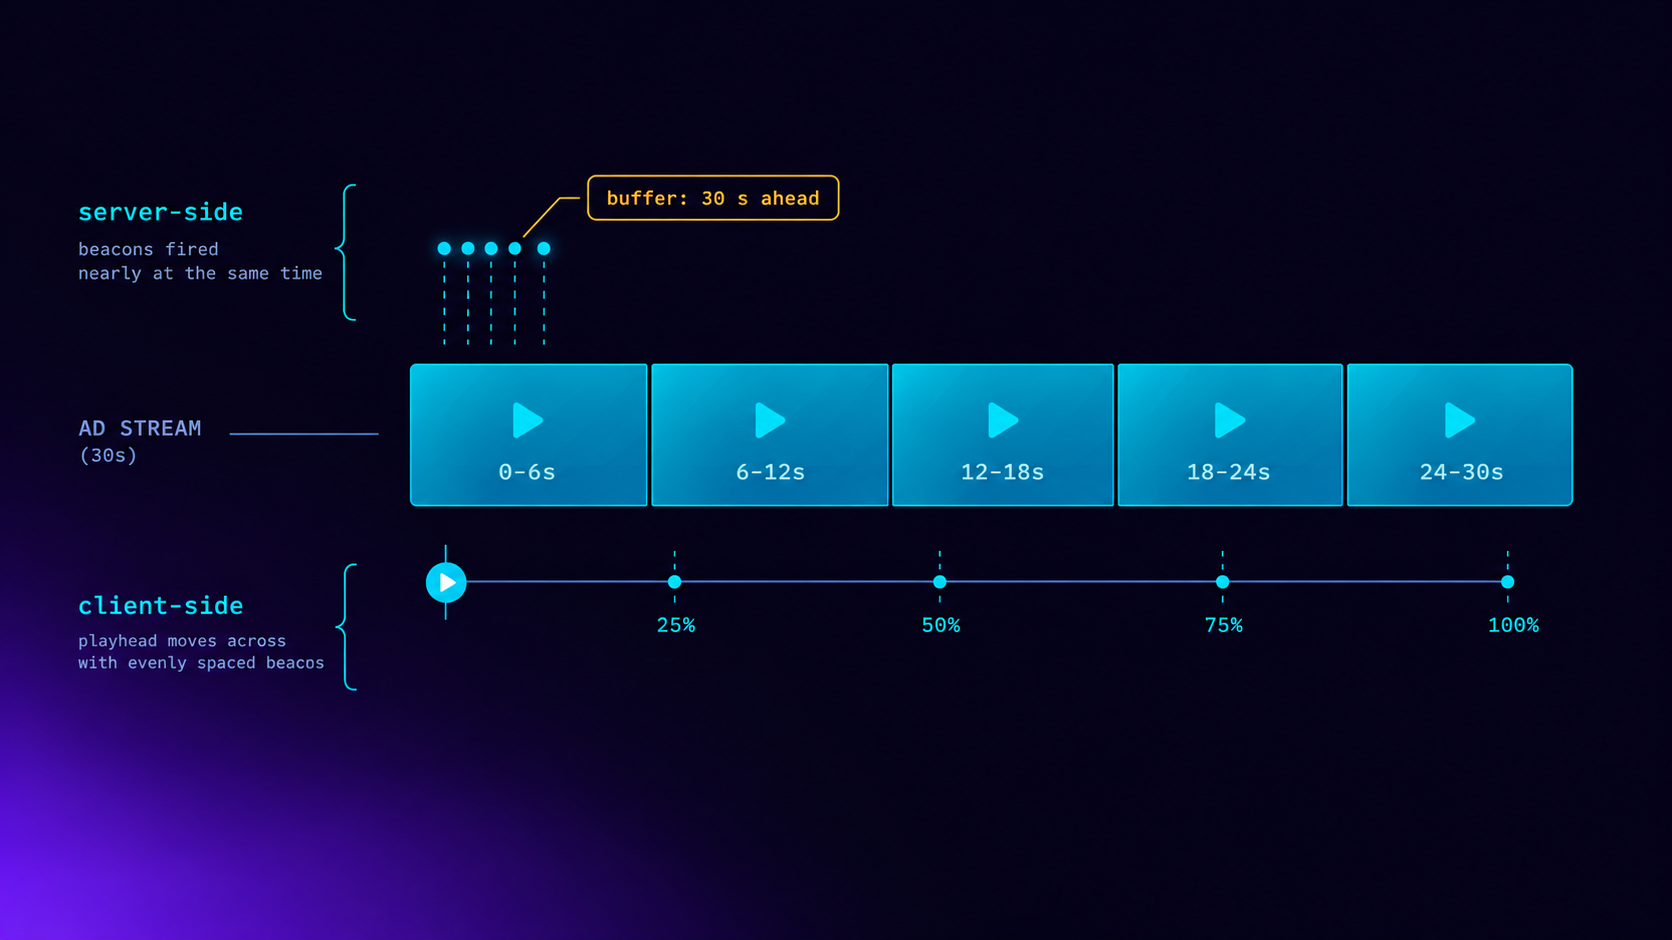
SSAI Tracking: Server-Side vs Client-Side Beacons
Server-side SSAI beacons fire when segments are fetched, not watched. How server and client tracking differ, and three problems both must solve.

SCTE-35 in HLS: What Breaks When You Stitch Live
Reading the SCTE-35 cue is easy. Filling the break, keeping HLS sequence numbers monotonic and deciding once across variants is where live SSAI fails.

VAST Error Codes in CTV: Which Ones Cost Money
Error 303 is usually no-fill. Errors 401 to 405 are won ads that never played. How to price each VAST error code in CTV, and who owns the fix.
Start trading TV
Ready to monetise CTV inventory?
See how LtvAdx fits your streaming and addressable TV setup — start free or book a walkthrough.
<10ms
Ad decision latency
P95, measured on the ad server
7-tier
HouseholdID graph tiers
UID2 · PPID · ADID · DeviceID · ACR · IP/24 · fingerprint
Illustrative platform metrics · System status